Fibo_Pivot_Lines_GMT
Download script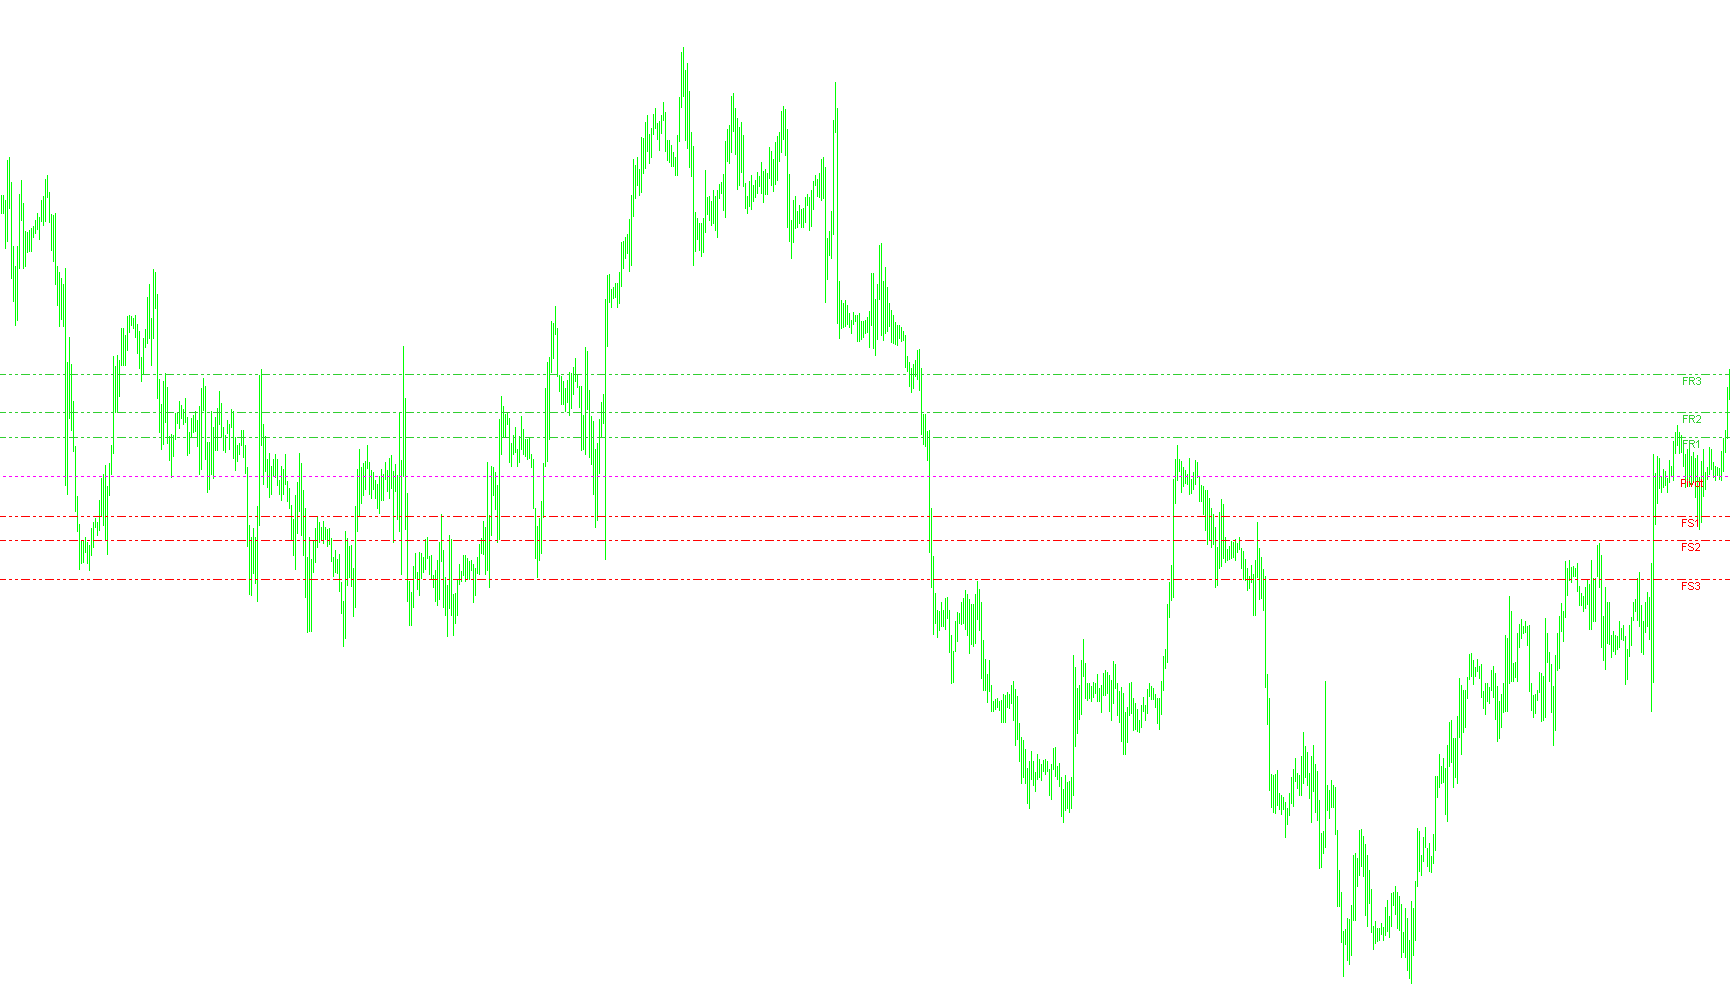
This script is designed to automatically calculate and display key price levels on your trading chart based on "Pivot Points." These levels help traders identify potential areas of support and resistance by using historical data from the previous trading day.
Core Logic and Functionality
Data Analysis The tool begins by scanning through past market data to find specific statistics from the previous trading session. Specifically, it identifies:
- The highest price reached (High)
- The lowest price reached (Low)
- The closing price at the end of the day
It performs this calculation by looking back through a specific number of historical bars, ensuring that the data is aligned correctly with your time zone settings.
Automated Calculations Once the previous day's highs, lows, and closes are identified, the script uses mathematical formulas to project several key levels for the current trading session:
- The Pivot Point (P): The central average of the previous day's range. This serves as the primary "balance" point for the market.
- Resistance Levels (R1, R2, R3): These represent price ceilings. They are calculated by adding specific percentages of the previous day's range to the Pivot Point. As the numbers increase, they represent more extreme potential "ceilings."
- Support Levels (S1, S2, S3): These represent price floors. They are calculated by subtracting those same percentages from the Pivot Point, highlighting areas where the price might find a base or bounce back up.
Visual Display The script handles all the visual heavy lifting for you by automatically drawing these levels on your chart:
- Dynamic Lines: It draws horizontal lines across your screen so you can see these levels in real-time.
- Color Coding: To make the chart easy to read at a glance, it uses distinct colors (such as Lime Green for Resistance and Red for Support) and different line styles (dotted/dashed) to differentiate between the various levels.
- Labels: It places text labels (e.g., "FR1", "FS2") directly on the lines, so you always know exactly which price level you are looking at without having to hover over the data.
Usage Requirements
For the script to work correctly, it requires that your chart timeframe is set to less than one day (such as 1-hour, 15-minute, or 5-minute charts). If the timeframe is too large (e.g., weekly or monthly), the script will notify you that it cannot perform the calculation.
//+-------------------------------------------------------------------+
//| Fibo Pivot Lines GMT.mq4                                                  |
//| Copyright © 2004, MetaQuotes Software Corp.                       |
//| http://www.metaquotes.net                                         |
//|                                                                   |
//| Modified by Hossein Paydar                                        |
//|                                                                   |
//| You are free to use it                                            |
//|                                                                   |
//|                                                                   |
//+-------------------------------------------------------------------+
#property copyright "Copyright © 2005, MetaQuotes Software Corp."
#property link      "http://www.metaquotes.net"

#property indicator_chart_window
//---- input parameters
extern int       GMTshift=0;
//+------------------------------------------------------------------+
//| Custom indicator initialization function                         |
//+------------------------------------------------------------------+
int init()
  {
//---- indicators
//----
   return(0);
  }
//+------------------------------------------------------------------+
//| Custor indicator deinitialization function                       |
//+------------------------------------------------------------------+
int deinit()
  {
//---- TODO: add your code here

//----
   return(0);
  }
//+------------------------------------------------------------------+
//| Custom indicator iteration function                              |
//+------------------------------------------------------------------+
int start()
  {
   int    counted_bars=IndicatorCounted();
//---- TODO: add your code here
double day_high=0;
double day_low=0;
double yesterday_high=0;
double yesterday_open=0;
double yesterday_low=0;
double yesterday_close=0;
double today_open=0;
double P=0,S=0,R=0,S1=0,R1=0,S2=0,R2=0,S3=0,R3=0;

//double D1=0.083333;
//double D2=0.166666;
//double D3=0.25;
//double D4=0.5;

int cnt=720;
double cur_day=0;
double prev_day=0;

double rates_d1[2][6];

//---- exit if period is greater than daily charts
if(Period() > 1440)
{
Print("Error - Chart period is greater than 1 day.");
return(-1); // then exit
}

//---- Get new daily prices & calculate pivots

while (cnt!= 0)
{
	cur_day = TimeDay(Time[cnt]- (GMTshift*3600));

	if (prev_day != cur_day)
	{
		yesterday_close = Close[cnt+1];
		today_open = Open[cnt];
		yesterday_high = day_high;
		yesterday_low = day_low;

		day_high = High[cnt];
		day_low  = Low[cnt];

		prev_day = cur_day;
		Comment ( yesterday_high + " " + yesterday_low + " " + yesterday_close );
	}

   if (High[cnt]>day_high)
   {
      day_high = High[cnt];
   }
   if (Low[cnt]<day_low)
   {
      day_low = Low[cnt];
   }

//	SetIndexValue(cnt, 0);
	cnt--;

}

//------ Pivot Points ------

R= (yesterday_high - yesterday_low);
P = (yesterday_high + yesterday_low + yesterday_close)/3;//Pivot
R1 = P + (R * 0.38);
R2 = P + (R * 0.62);
R3 = P + (R * 0.99);
S1 = P - (R * 0.38);
S2 = P - (R * 0.62);
S3 = P - (R * 0.99);

//---- Set line labels on chart window

if(ObjectFind("P label") != 0)
{
ObjectCreate("P label", OBJ_TEXT, 0, Time[20], P);
ObjectSetText("P label", " Pivot", 8, "Arial", Red);
}
else
{
ObjectMove("P label", 0, Time[20], P);
}
      if(ObjectFind("FR1 label") != 0)
      {
      ObjectCreate("FR1 label", OBJ_TEXT, 0, Time[20], R1);
      ObjectSetText("FR1 label", " FR1", 8, "Arial", LimeGreen);
      }
      else
      {
      ObjectMove("FR1 label", 0, Time[20], R1);
      }

      if(ObjectFind("FR2 label") != 0)
      {
      ObjectCreate("FR2 label", OBJ_TEXT, 0, Time[20], R2);
      ObjectSetText("FR2 label", " FR2", 8, "Arial", LimeGreen);
      }
      else
      {
      ObjectMove("FR2 label", 0, Time[20], R2);
      }

      if(ObjectFind("FR3 label") != 0)
      {
      ObjectCreate("FR3 label", OBJ_TEXT, 0, Time[20], R3);
      ObjectSetText("FR3 label", " FR3", 8, "Arial", LimeGreen);
      }
      else
      {
      ObjectMove("FR3 label", 0, Time[20], R3);
      }

      if(ObjectFind("FS1 label") != 0)
      {
      ObjectCreate("FS1 label", OBJ_TEXT, 0, Time[20], S1);
      ObjectSetText("FS1 label", "FS1", 8, "Arial", Red);
      }
      else
      {
      ObjectMove("FS1 label", 0, Time[20], S1);
      }

      if(ObjectFind("FS2 label") != 0)
      {
      ObjectCreate("FS2 label", OBJ_TEXT, 0, Time[20], S2);
      ObjectSetText("FS2 label", "FS2", 8, "Arial", Red);
      }
      else
      {
      ObjectMove("FS2 label", 0, Time[20], S2);
      }

      if(ObjectFind("FS3 label") != 0)
      {
      ObjectCreate("FS3 label", OBJ_TEXT, 0, Time[20], S3);
      ObjectSetText("FS3 label", "FS3", 8, "Arial", Red);
      }
      else
      {
      ObjectMove("FS3 label", 0, Time[20], S3);
      }

//---- Set lines on chart window
//----- PIVOT --------


if(ObjectFind("P line") != 0)
{
ObjectCreate("P line", OBJ_HLINE, 0, Time[40], P);
ObjectSet("P line", OBJPROP_STYLE, STYLE_DOT);
ObjectSet("P line", OBJPROP_COLOR, Magenta);
}
else
{
ObjectMove("P line", 0, Time[40], P);
}

if(ObjectFind("FR1 line") != 0)
{
ObjectCreate("FR1 line", OBJ_HLINE, 0, Time[40], R1);
ObjectSet("FR1 line", OBJPROP_STYLE, STYLE_DASHDOTDOT);
ObjectSet("FR1 line", OBJPROP_COLOR, LimeGreen);
}
else
{
ObjectMove("FR1 line", 0, Time[40], R1);
}

if(ObjectFind("FS1 line") != 0)
{
ObjectCreate("FS1 line", OBJ_HLINE, 0, Time[40], S1);
ObjectSet("FS1 line", OBJPROP_STYLE, STYLE_DASHDOTDOT);
ObjectSet("FS1 line", OBJPROP_COLOR, Red);
}
else
{
ObjectMove("FS1 line", 0, Time[40], S1);
}

if(ObjectFind("FR2 line") != 0)
{
ObjectCreate("FR2 line", OBJ_HLINE, 0, Time[40], R2);
ObjectSet("FR2 line", OBJPROP_STYLE, STYLE_DASHDOTDOT);
ObjectSet("FR2 line", OBJPROP_COLOR, LimeGreen);
}
else
{
ObjectMove("FR2 line", 0, Time[40], R2);
}

if(ObjectFind("FS2 line") != 0)
{
ObjectCreate("FS2 line", OBJ_HLINE, 0, Time[40], S2);
ObjectSet("FS2 line", OBJPROP_STYLE, STYLE_DASHDOTDOT);
ObjectSet("FS2 line", OBJPROP_COLOR, Red);
}
else
{
ObjectMove("FS2 line", 0, Time[40], S2);
}

if(ObjectFind("FR3 line") != 0)
{
ObjectCreate("FR3 line", OBJ_HLINE, 0, Time[40], R3);
ObjectSet("FR3 line", OBJPROP_STYLE, STYLE_DASHDOTDOT);
ObjectSet("FR3 line", OBJPROP_COLOR, LimeGreen);
}
else
{
ObjectMove("FR3 line", 0, Time[40], R3);
}

if(ObjectFind("FS3 line") != 0)
{
ObjectCreate("FS3 line", OBJ_HLINE, 0, Time[40], S3);
ObjectSet("FS3 line", OBJPROP_STYLE, STYLE_DASHDOTDOT);
ObjectSet("FS3 line", OBJPROP_COLOR, Red);
}
else
{
ObjectMove("FS3 line", 0, Time[40], S3);
}

//---- done

//----
   return(0);
  }
//+------------------------------------------------------------------+
Comments