Fib_Pivots_02_v1
Download script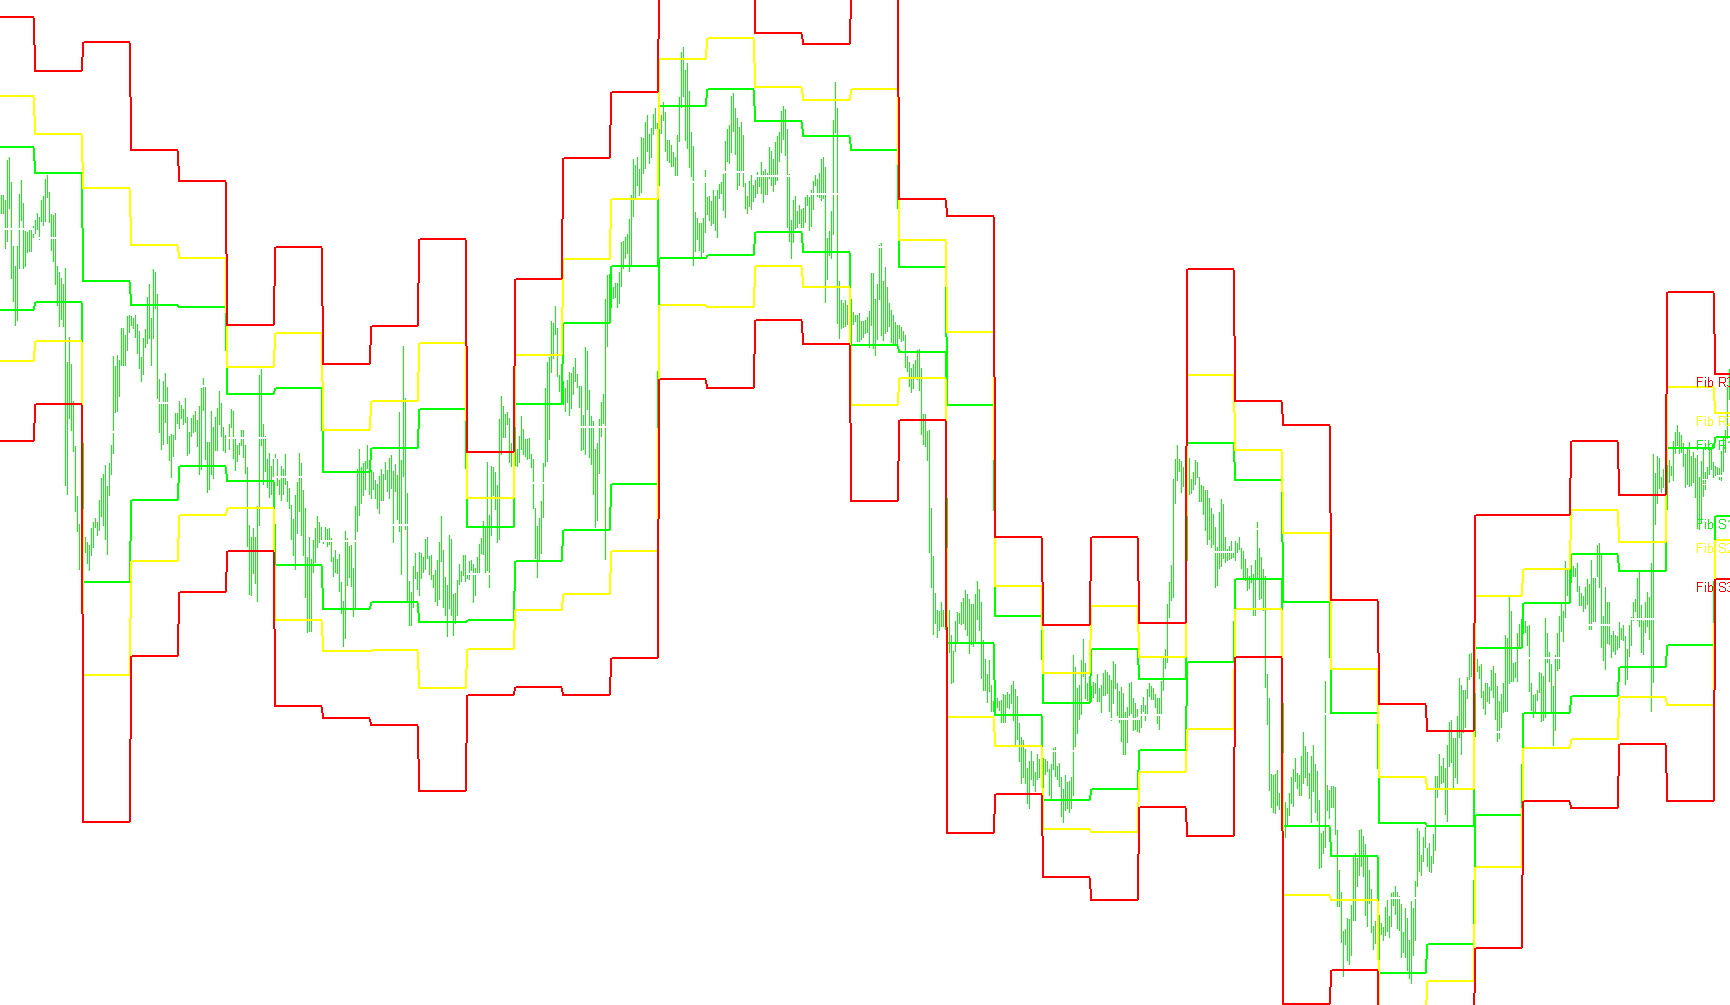
This technical indicator is designed to provide traders with a comprehensive set of automated price levels by combining two popular market analysis techniques: Pivot Points and Fibonacci Retracements. By blending these methods, the script identifies potential areas of support (where prices might stop falling) and resistance (where prices might stop rising) based on previous market behavior.
Core Logic Overview
The tool functions by analyzing price action from the previous trading day to project levels for the current day. Here is a breakdown of how it processes that data:
1. Identifying Key Price Boundaries The script constantly monitors the price movement to find the highest point (High) and the lowest point (Low) reached during a specific timeframe. Once a new day begins, it captures these two extreme values to establish the "range" of the previous session.
2. Calculating the Pivot Point The central "Pivot" is calculated by taking the average of the previous day's High, Low, and the Closing price. This serves as the baseline or equilibrium point for the current day's price action.
3. Integrating Fibonacci Proportions Unlike standard pivot points which use fixed increments, this script applies Fibonacci ratios to the daily range. It calculates three distinct levels of support and resistance based on significant mathematical proportions:
- Primary Levels (S1/R1): Derived from the 0.382 ratio. These represent the first major areas where price might react shortly after opening.
- Secondary Levels (S2/R2): Derived from the 0.618 ratio (the "Golden Ratio"). these are stronger areas of interest where significant trend reversals often occur.
- Tertiary Levels (S3/R3): Derived from the 0.99 ratio. These represent the outer boundaries of the market's expected movement for the day.
Visual Representation
The script automatically plots these levels as horizontal lines on your chart:
- White: The central Pivot Point.
- Lime/Yellow: The primary and secondary Fibonacci Support and Resistance levels.
- Red: The extreme Fibonacci boundaries.
By providing these levels automatically, the tool removes the manual calculation work for the trader, allowing you to see at a glance where the "walls" of supply and demand are located based on the previous day's volatility.
/*-----------------------------+
|			       |
| Shared by www.Aptrafx.com    |
|			       |
+------------------------------*/

//+------------------------------------------------------------------+
//|                                                   Pivot_Fibs.mq4 |
//|                            Copyright © 2006, Archer Trading, LLC |
//|                                    http://www.archertrading.net/ |
//+------------------------------------------------------------------+
#property copyright "Archer Trading, LLC"
#property link      "http://www.archertrading.net/"

#property indicator_chart_window
#property indicator_buffers 7
#property indicator_color1 White
#property indicator_color2 Lime
#property indicator_color3 Lime
#property indicator_color4 Yellow
#property indicator_color5 Yellow
#property indicator_color6 Red
#property indicator_color7 Red


double PBuffer[];
double S1Buffer[];
double R1Buffer[];
double S2Buffer[];
double R2Buffer[];
double S3Buffer[];
double R3Buffer[];
double S0Buffer[];
double R0Buffer[];
string Pivot="Pivot Point",FibS1="S 1", FibR1="R 1";
string FibS2="S 2", FibR2="R 2", FibS3="S 3", FibR3="R 3";
int fontsize=10;
double P,R,S1,R1,S2,R2,S3,R3;
double LastHigh,LastLow,x;

//+------------------------------------------------------------------+
//| Custor indicator deinitialization function                       |
//+------------------------------------------------------------------+
int deinit()
  {


   ObjectDelete("Pivot");
   ObjectDelete("FibS1");
   ObjectDelete("FibR1");
   ObjectDelete("FibS2");
   ObjectDelete("FibR1");
   ObjectDelete("FibS3");
   ObjectDelete("FibR2");

//----
   return(0);
  }
//+------------------------------------------------------------------+
//| Custom indicator initialization function                         |
//+------------------------------------------------------------------+
int init()
  {
   string short_name;


   SetIndexStyle(0,DRAW_LINE,0,2,White);
   SetIndexStyle(1,DRAW_LINE,0,2,Lime);
   SetIndexStyle(2,DRAW_LINE,0,2,Lime);
   SetIndexStyle(3,DRAW_LINE,0,2,Yellow);
   SetIndexStyle(4,DRAW_LINE,0,2,Yellow);
   SetIndexStyle(5,DRAW_LINE,0,2,Red);
   SetIndexStyle(6,DRAW_LINE,0,2,Red);
   SetIndexBuffer(0,PBuffer);
   SetIndexBuffer(1,S1Buffer);
   SetIndexBuffer(2,R1Buffer);
   SetIndexBuffer(3,S2Buffer);
   SetIndexBuffer(4,R2Buffer);
   SetIndexBuffer(5,S3Buffer);
   SetIndexBuffer(6,R3Buffer);


//---- name for DataWindow and indicator subwindow label
   short_name="Fibonacci Pivot Points";
   IndicatorShortName(short_name);
   SetIndexLabel(0,short_name);

//----
   SetIndexDrawBegin(0,1);
//----


//----
   return(0);
  }

//+------------------------------------------------------------------+
//| Custom indicator iteration function                              |
//+------------------------------------------------------------------+
int start()

  {
   int    counted_bars=IndicatorCounted();

   int limit, i;
//---- indicator calculation
if (counted_bars==0)
{
   x=Period();
   if (x>240) return(-1);
   ObjectCreate("Pivot", OBJ_TEXT, 0, 0,0);
   ObjectSetText("Pivot", "Pivot",fontsize,"Arial",White);
   ObjectCreate("FibS1", OBJ_TEXT, 0, 0, 0);
   ObjectSetText("FibS1", "Fib S1",fontsize,"Arial",Lime);
   ObjectCreate("FibR1", OBJ_TEXT, 0, 0, 0);
   ObjectSetText("FibR1", "Fib R1",fontsize,"Arial",Lime);
   ObjectCreate("FibS2", OBJ_TEXT, 0, 0, 0);
   ObjectSetText("FibS2", "Fib S2",fontsize,"Arial",Yellow);
   ObjectCreate("FibR2", OBJ_TEXT, 0, 0, 0);
   ObjectSetText("FibR2", "Fib R2",fontsize,"Arial",Yellow);
   ObjectCreate("FibS3", OBJ_TEXT, 0, 0, 0);
   ObjectSetText("FibS3", "Fib S3",fontsize,"Arial",Red);
   ObjectCreate("FibR3", OBJ_TEXT, 0, 0, 0);
   ObjectSetText("FibR3", "Fib R3",fontsize,"Arial",Red);
}
   if(counted_bars<0) return(-1);
//---- last counted bar will be recounted
//   if(counted_bars>0) counted_bars--;
   limit=(Bars-counted_bars)-1;


for (i=limit; i>=0;i--)
{

if (High[i+1]>LastHigh) LastHigh=High[i+1];
if (Low[i+1]<LastLow) LastLow=Low[i+1];
if (TimeDay(Time[i])!=TimeDay(Time[i+1]))
   {
   P=(LastHigh+LastLow+Close[i+1])/3;
   R = LastHigh-LastLow;
   R1 = P + (R * 0.382);
   S1 = P - (R * 0.382);
   R2 = P + (R * 0.618);
   S2 = P - (R * 0.618);
   R3 = P + (R * 0.99);
   S3 = P - (R * 0.99);
   LastLow=Open[i]; LastHigh=Open[i];

   ObjectMove("Pivot", 0, Time[i],P);
   ObjectMove("FibS1", 0, Time[i],S1);
   ObjectMove("FibR1", 0, Time[i],R1);
   ObjectMove("FibS2", 0, Time[i],S2);
   ObjectMove("FibR2", 0, Time[i],R2);
   ObjectMove("FibS3", 0, Time[i],S3);
   ObjectMove("FibR3", 0, Time[i],R3);

   }

    PBuffer[i]=P;
    S1Buffer[i]=S1;
    R1Buffer[i]=R1;
    S2Buffer[i]=S2;
    R2Buffer[i]=R2;
    S3Buffer[i]=S3;
    R3Buffer[i]=R3;
}

//----
   return(0);
  }
//+------------------------------------------------------------------+
Comments