Fib Pivots 02
Download script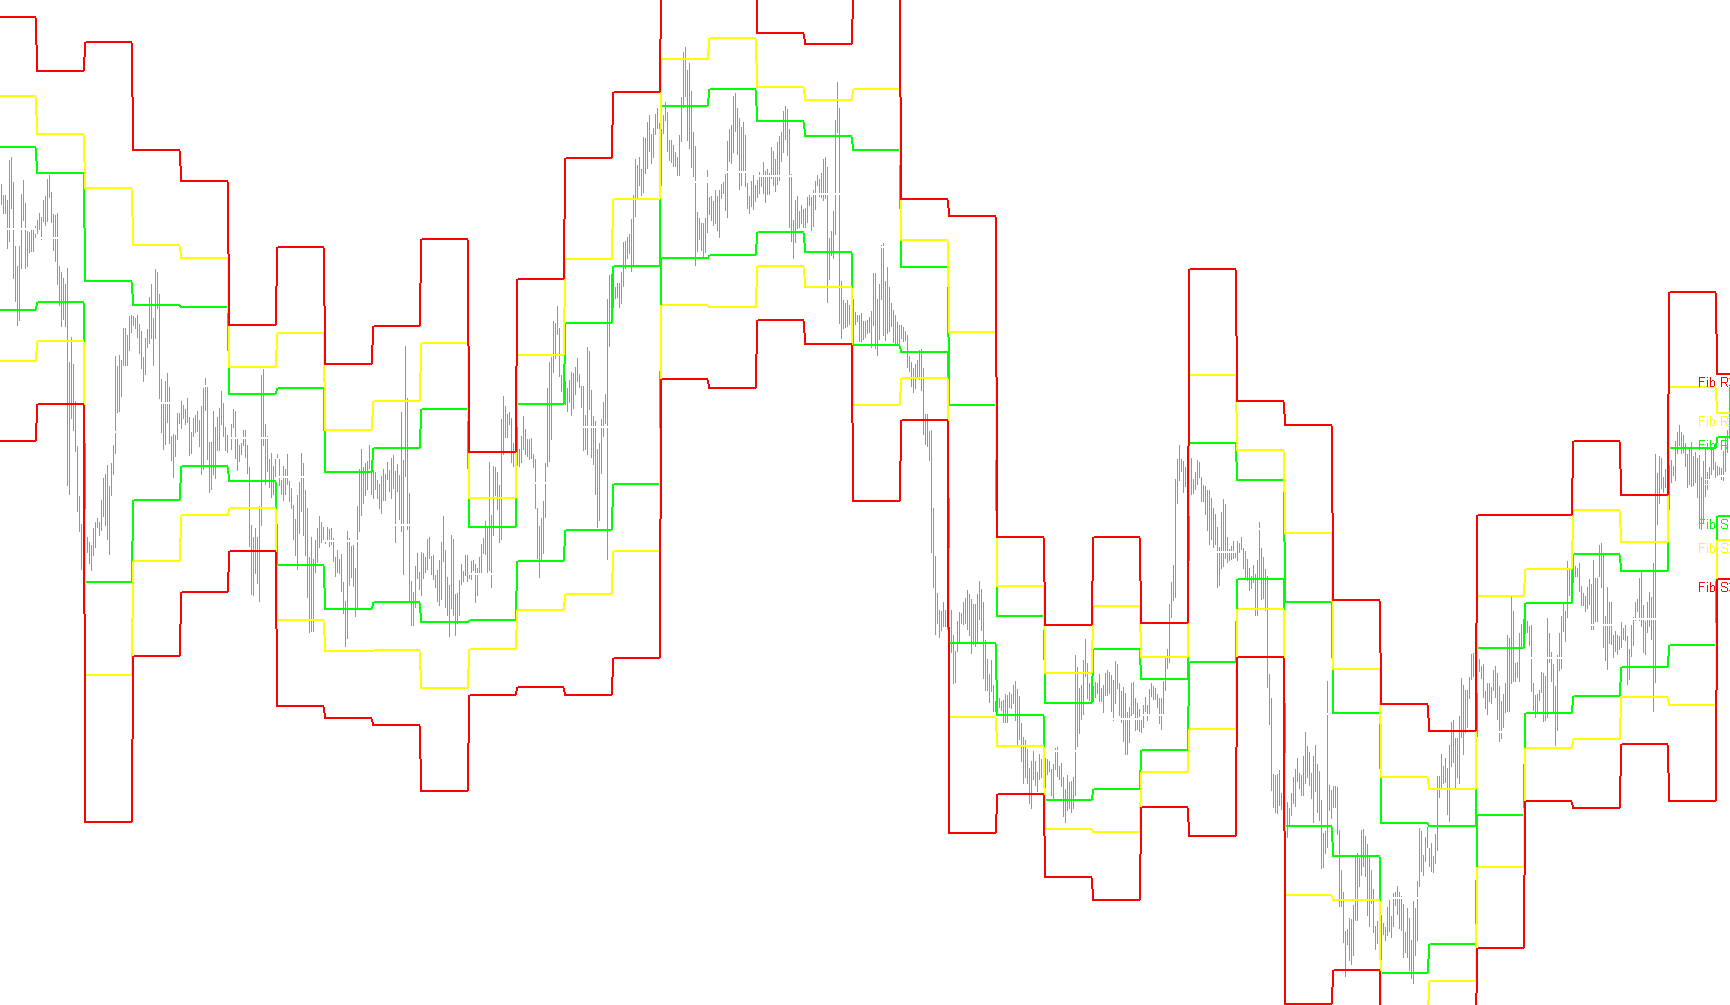
This script is designed to automatically calculate and visualize two distinct types of financial trading levels—Pivot Points and Fibonacci Retracements—directly on your trading chart. It simplifies the process of identifying potential support and resistance zones by doing the heavy lifting of the math for you.
Core Functionality
The logic operates by scanning historical price data to identify significant structural points. Instead of just looking at a single price, it tracks the highest highs and lowest lows within specific timeframes to establish a "range" of price action.
1. Pivot Point Calculation
The script identifies the "Pivot Point" for each day. It takes the high and low prices of the previous session and combines them with the closing price to find a balanced equilibrium point. This represents the central "magnet" or pivot around which the price might rotate.
2. Fibonacci Retracement Levels
Building on the high and low values identified during the scan, the script automatically calculates three distinct levels of retracement:
- Level 1: Based on a 0.382 ratio.
- Level 2: Based on a 0.618 ratio (the "Golden Ratio").
- Level 3: Based on a 0.99 ratio.
These levels help traders visualize where the market might "pull back" or "correct" itself before continuing its primary trend. By plotting these alongside the Pivot Point, you get a comprehensive map of potential turning points.
Visual Presentation
To make this data easy to read at a glance, the script uses a color-coded system for the various lines and text labels:
- Pivot Point: Displayed in White.
- Level 1 (S1 & R1): Displayed in Lime Green.
- Level 2 (S2 & R2): Displayed in Yellow.
- Level 3 (S3 & R3): Displayed in Red.
How it Behaves on the Chart
- Dynamic Updates: The script moves and updates these labels automatically as new price data arrives, ensuring the levels stay relevant to the current market movement.
- Automatic Cleanup: When you remove the indicator from your chart, the script is programmed to "clean up" after itself by deleting all the lines and text objects it created, leaving your workspace tidy.
- Compatibility: It includes a check to ensure it only runs on appropriate timeframes, preventing errors and ensuring the visual data remains accurate to the chosen scale.
ÿþ//+------------------------------------------------------------------+
//|                                                   Pivot_Fibs.mq4 |
//|                            Copyright ýÿ 2006, Archer Trading, LLC |
//|                                    http://www.archertrading.net/ |
//+------------------------------------------------------------------+
#property copyright "Archer Trading, LLC"
#property link      "http://www.archertrading.net/"

#property indicator_chart_window
#property indicator_buffers 7
#property indicator_color1 White
#property indicator_color2 Lime
#property indicator_color3 Lime
#property indicator_color4 Yellow
#property indicator_color5 Yellow
#property indicator_color6 Red
#property indicator_color7 Red


double PBuffer[];
double S1Buffer[];
double R1Buffer[];
double S2Buffer[];
double R2Buffer[];
double S3Buffer[];
double R3Buffer[];
double S0Buffer[];
double R0Buffer[];
string Pivot="Pivot Point",FibS1="S 1", FibR1="R 1";
string FibS2="S 2", FibR2="R 2", FibS3="S 3", FibR3="R 3";
int fontsize=10;
double P,R,S1,R1,S2,R2,S3,R3;
double LastHigh,LastLow,x;

//+------------------------------------------------------------------+
//| Custor indicator deinitialization function                       |
//+------------------------------------------------------------------+
int deinit()
  {


   ObjectDelete("Pivot");
   ObjectDelete("FibS1");
   ObjectDelete("FibR1");
   ObjectDelete("FibS2");
   ObjectDelete("FibR1");
   ObjectDelete("FibS3");
   ObjectDelete("FibR2");

//----
   return(0);
  }
//+------------------------------------------------------------------+
//| Custom indicator initialization function                         |
//+------------------------------------------------------------------+
int init()
  {
   string short_name;


   SetIndexStyle(0,DRAW_LINE,0,2,White);
   SetIndexStyle(1,DRAW_LINE,0,2,Lime);
   SetIndexStyle(2,DRAW_LINE,0,2,Lime);
   SetIndexStyle(3,DRAW_LINE,0,2,Yellow);
   SetIndexStyle(4,DRAW_LINE,0,2,Yellow);
   SetIndexStyle(5,DRAW_LINE,0,2,Red);
   SetIndexStyle(6,DRAW_LINE,0,2,Red);
   SetIndexBuffer(0,PBuffer);
   SetIndexBuffer(1,S1Buffer);
   SetIndexBuffer(2,R1Buffer);
   SetIndexBuffer(3,S2Buffer);
   SetIndexBuffer(4,R2Buffer);
   SetIndexBuffer(5,S3Buffer);
   SetIndexBuffer(6,R3Buffer);


//---- name for DataWindow and indicator subwindow label
   short_name="Fibonacci Pivot Points";
   IndicatorShortName(short_name);
   SetIndexLabel(0,short_name);

//----
   SetIndexDrawBegin(0,1);
//----


//----
   return(0);
  }

//+------------------------------------------------------------------+
//| Custom indicator iteration function                              |
//+------------------------------------------------------------------+
int start()

  {
   int    counted_bars=IndicatorCounted();

   int limit, i;
//---- indicator calculation
if (counted_bars==0)
{
   x=Period();
   if (x>240) return(-1);
   ObjectCreate("Pivot", OBJ_TEXT, 0, 0,0);
   ObjectSetText("Pivot", "Pivot",fontsize,"Arial",White);
   ObjectCreate("FibS1", OBJ_TEXT, 0, 0, 0);
   ObjectSetText("FibS1", "Fib S1",fontsize,"Arial",Lime);
   ObjectCreate("FibR1", OBJ_TEXT, 0, 0, 0);
   ObjectSetText("FibR1", "Fib R1",fontsize,"Arial",Lime);
   ObjectCreate("FibS2", OBJ_TEXT, 0, 0, 0);
   ObjectSetText("FibS2", "Fib S2",fontsize,"Arial",Yellow);
   ObjectCreate("FibR2", OBJ_TEXT, 0, 0, 0);
   ObjectSetText("FibR2", "Fib R2",fontsize,"Arial",Yellow);
   ObjectCreate("FibS3", OBJ_TEXT, 0, 0, 0);
   ObjectSetText("FibS3", "Fib S3",fontsize,"Arial",Red);
   ObjectCreate("FibR3", OBJ_TEXT, 0, 0, 0);
   ObjectSetText("FibR3", "Fib R3",fontsize,"Arial",Red);
}
   if(counted_bars<0) return(-1);
//---- last counted bar will be recounted
//   if(counted_bars>0) counted_bars--;
   limit=(Bars-counted_bars)-1;


for (i=limit; i>=0;i--)
{

if (High[i+1]>LastHigh) LastHigh=High[i+1];
if (Low[i+1]<LastLow) LastLow=Low[i+1];
if (TimeDay(Time[i])!=TimeDay(Time[i+1]))
   {
   P=(LastHigh+LastLow+Close[i+1])/3;
   R = LastHigh-LastLow;
   R1 = P + (R * 0.382);
   S1 = P - (R * 0.382);
   R2 = P + (R * 0.618);
   S2 = P - (R * 0.618);
   R3 = P + (R * 0.99);
   S3 = P - (R * 0.99);
   LastLow=Open[i]; LastHigh=Open[i];

   ObjectMove("Pivot", 0, Time[i],P);
   ObjectMove("FibS1", 0, Time[i],S1);
   ObjectMove("FibR1", 0, Time[i],R1);
   ObjectMove("FibS2", 0, Time[i],S2);
   ObjectMove("FibR2", 0, Time[i],R2);
   ObjectMove("FibS3", 0, Time[i],S3);
   ObjectMove("FibR3", 0, Time[i],R3);

   }

    PBuffer[i]=P;
    S1Buffer[i]=S1;
    R1Buffer[i]=R1;
    S2Buffer[i]=S2;
    R2Buffer[i]=R2;
    S3Buffer[i]=S3;
    R3Buffer[i]=R3;
}

//----
   return(0);
  }
//+------------------------------------------------------------------+
Comments