ExVolv2
Download script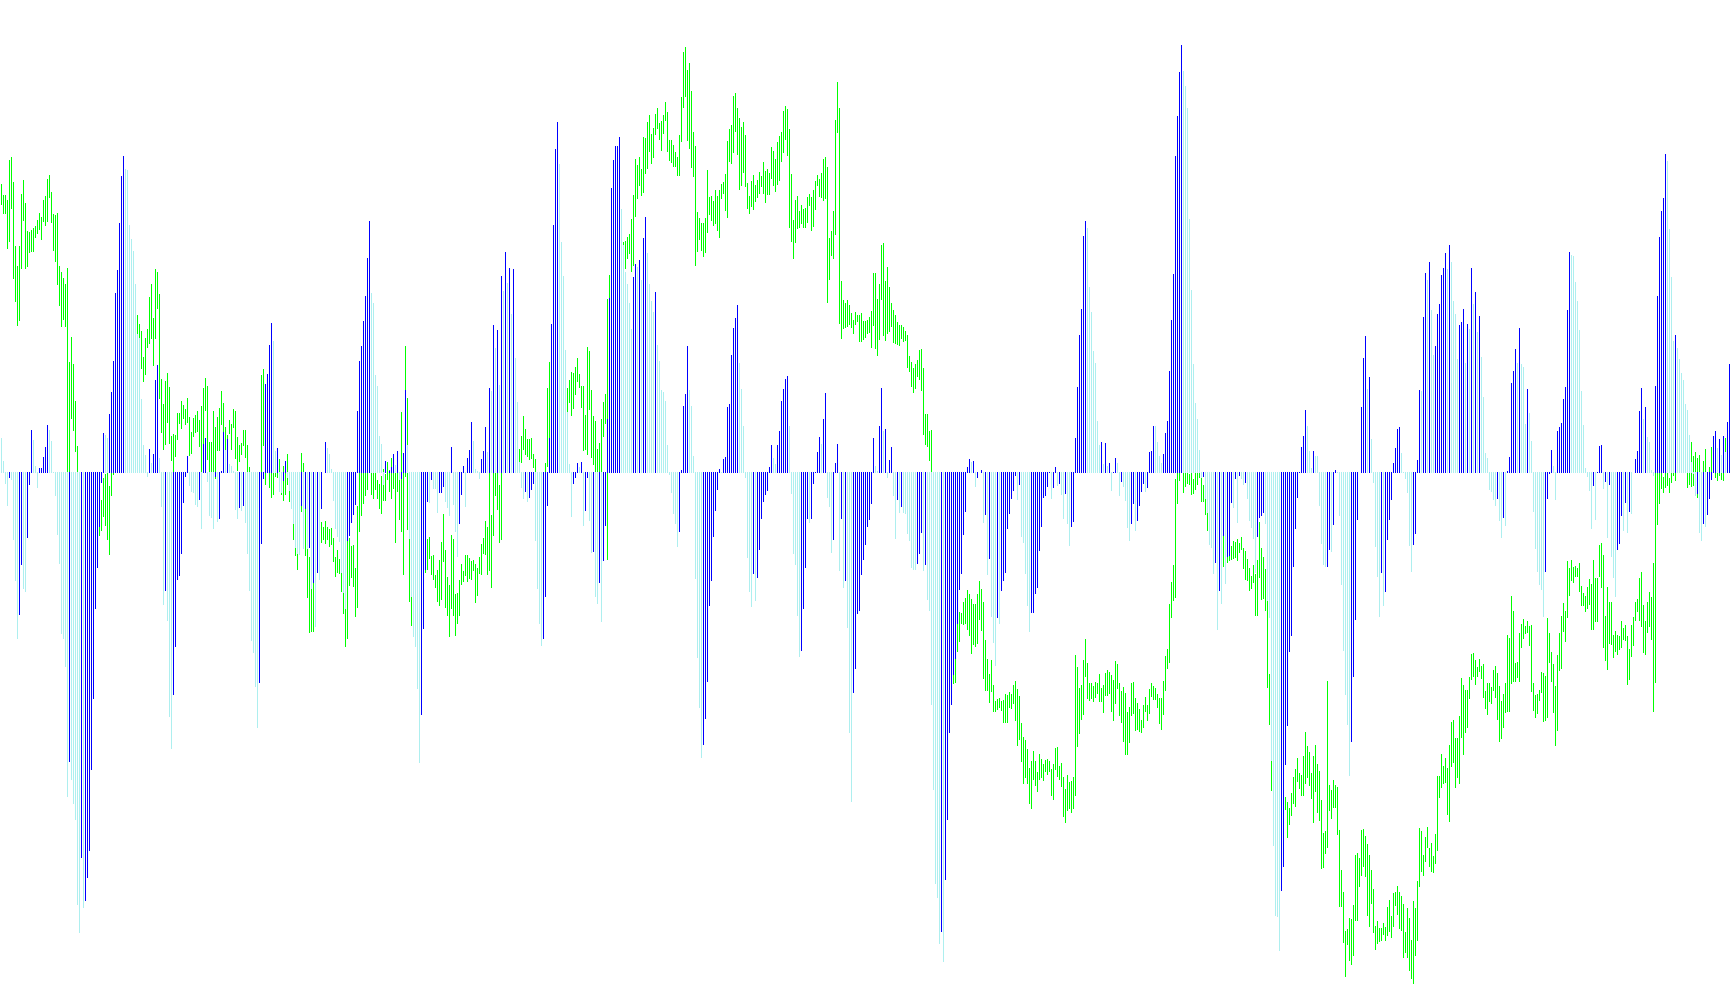
This custom technical indicator is designed to provide traders with a visual representation of market momentum by analyzing price movement and historical data. Rather than just looking at simple price changes, it interprets the "strength" of the market based on how much the price moved in either an upward or downward direction over a specific period.
Core Logic and Functionality
The indicator operates by calculating the cumulative difference between opening and closing prices over a user-defined timeframe. Here is a breakdown of how it processes that information:
1. Directional Movement Tracking The script looks at a set number of previous candles (determined by the "ExPeriod" setting). It distinguishes between "positive" movement (where the price closed higher than it opened) and "negative" movement (where it closed lower). It then calculates the total magnitude of these movements to determine which side of the market is currently exerting more pressure.
2. Momentum Balancing Instead of just showing raw numbers, the script performs a calculation to balance the positive and negative forces. It subtracts the total negative movement from the total positive movement, creating a net momentum value. This helps filter out "noise" and highlights whether the prevailing trend is dominant or if the market is experiencing conflicting pressure.
3. Smoothing and Normalization To ensure the data is readable and not erratic, the script utilizes a normalization process. It takes the current calculated momentum and averages it against previous results over a small window. This smoothing effect helps prevent the indicator from jumping wildly, making it easier for a trader to identify consistent trends rather than momentary spikes.
4. Visual Representation The final output is displayed in a separate window on your chart as a histogram.
- It uses two distinct colors (typically Blue and Red) to signify different directional pressures.
- By comparing the current smoothed value against the previous value, the indicator determines whether momentum is gaining strength or weakening.
- The result is a visual "flow" that tells you at a glance whether the market energy is tilting significantly toward the upside or the downside.
Summary for the Trader
In simple terms, this tool acts as a momentum meter. It looks back at a specific window of time, calculates the total "push" from buyers versus sellers, and smooths out that data into a clean visual histogram. It allows you to see the underlying strength of a trend beyond what the price candles alone might show.
//+------------------------------------------------------------------+
//|                                                      ExVolv2.mq4 |
//|                           Copyright © 2006, Alex Sidd (Executer) |
//|                                       http://www.metaquotes.net/ |
//+------------------------------------------------------------------+
#property copyright "Copyright © 2006, Alex Sidd (Executer)"
#property link      "mailto:work_st@mail.ru"
//----
#property indicator_separate_window
#property indicator_buffers 3
#property  indicator_color1  Black
#property  indicator_color2  Blue
#property  indicator_color3  Red
//---- input parameters
extern int ExPeriod = 6;
extern int Normalize = 3;
//---- buffers
double VolBuffer[];
double PosBuffer[];
double NegBuffer[];
double pos;
//+------------------------------------------------------------------+
//| initialization function                                          |
//+------------------------------------------------------------------+
int init()
  {
   string short_name;
   IndicatorBuffers(3);
   SetIndexStyle(0, DRAW_NONE);
   SetIndexBuffer(0, VolBuffer);
   SetIndexStyle(1, DRAW_HISTOGRAM);
   SetIndexBuffer(1, PosBuffer);
   SetIndexStyle(2, DRAW_HISTOGRAM);
   SetIndexBuffer(2, NegBuffer);
   SetIndexDrawBegin(0, ExPeriod);
   SetIndexDrawBegin(1, ExPeriod);
   SetIndexDrawBegin(2, ExPeriod);
//----
   SetIndexLabel(1, NULL);
   SetIndexLabel(2, NULL);
//----
   short_name="ExVol(" + ExPeriod + ")";
   IndicatorShortName(short_name);
   SetIndexLabel(0, short_name);
//----
   return(0);
  }
//+------------------------------------------------------------------+
//| Executer Vol Indicator                                           |
//+------------------------------------------------------------------+
int start()
  {
   int    i, counted_bars = IndicatorCounted();
   double negative = 0, positive = 0;
//----
   if(Bars <= ExPeriod)
       return(0);
   if(counted_bars < 1)
       for(i = 1; i <= ExPeriod; i++)
           VolBuffer[Bars-i] = 0.0;
//----
   i = Bars - ExPeriod - 1;
   if(counted_bars >= ExPeriod)
       i = Bars -counted_bars - 1;
   while(i >= 0)
     {
       negative = 0;
       positive = 0;
       if(i < Bars - ExPeriod - 1)
         {
           int k = i + ExPeriod;
           while(k >= i)
             {
               if(Open[k] < Close[k])
                   positive += (Close[k] - Open[k]);
               if(Open[k] > Close[k])
                   negative += (Open[k] - Close[k]);
               if(Open[k] == Close[k])
                   {
                     negative += 0;
                     positive += 0;
                   }
               k--;
             }
         }
       double poss = 0;
       if(Normalize < 1)
           Normalize = 1;
       if(Normalize > 1000)
           Normalize = 1000;
       for(int j = 1; j != Normalize; j++)
         {
           poss += VolBuffer[i+j];
         }
       pos = (poss + ((positive - negative)*3000)) / Normalize;
       if(VolBuffer[i+1] < pos)
           PosBuffer[i] = pos;
       if(VolBuffer[i+1] > pos)
           NegBuffer[i]=pos;
       VolBuffer[i]=pos;
       i--;
     }
//----
   return(0);
  }
//+------------------------------------------------------------------+
Comments