ExVlBars_v2
Download script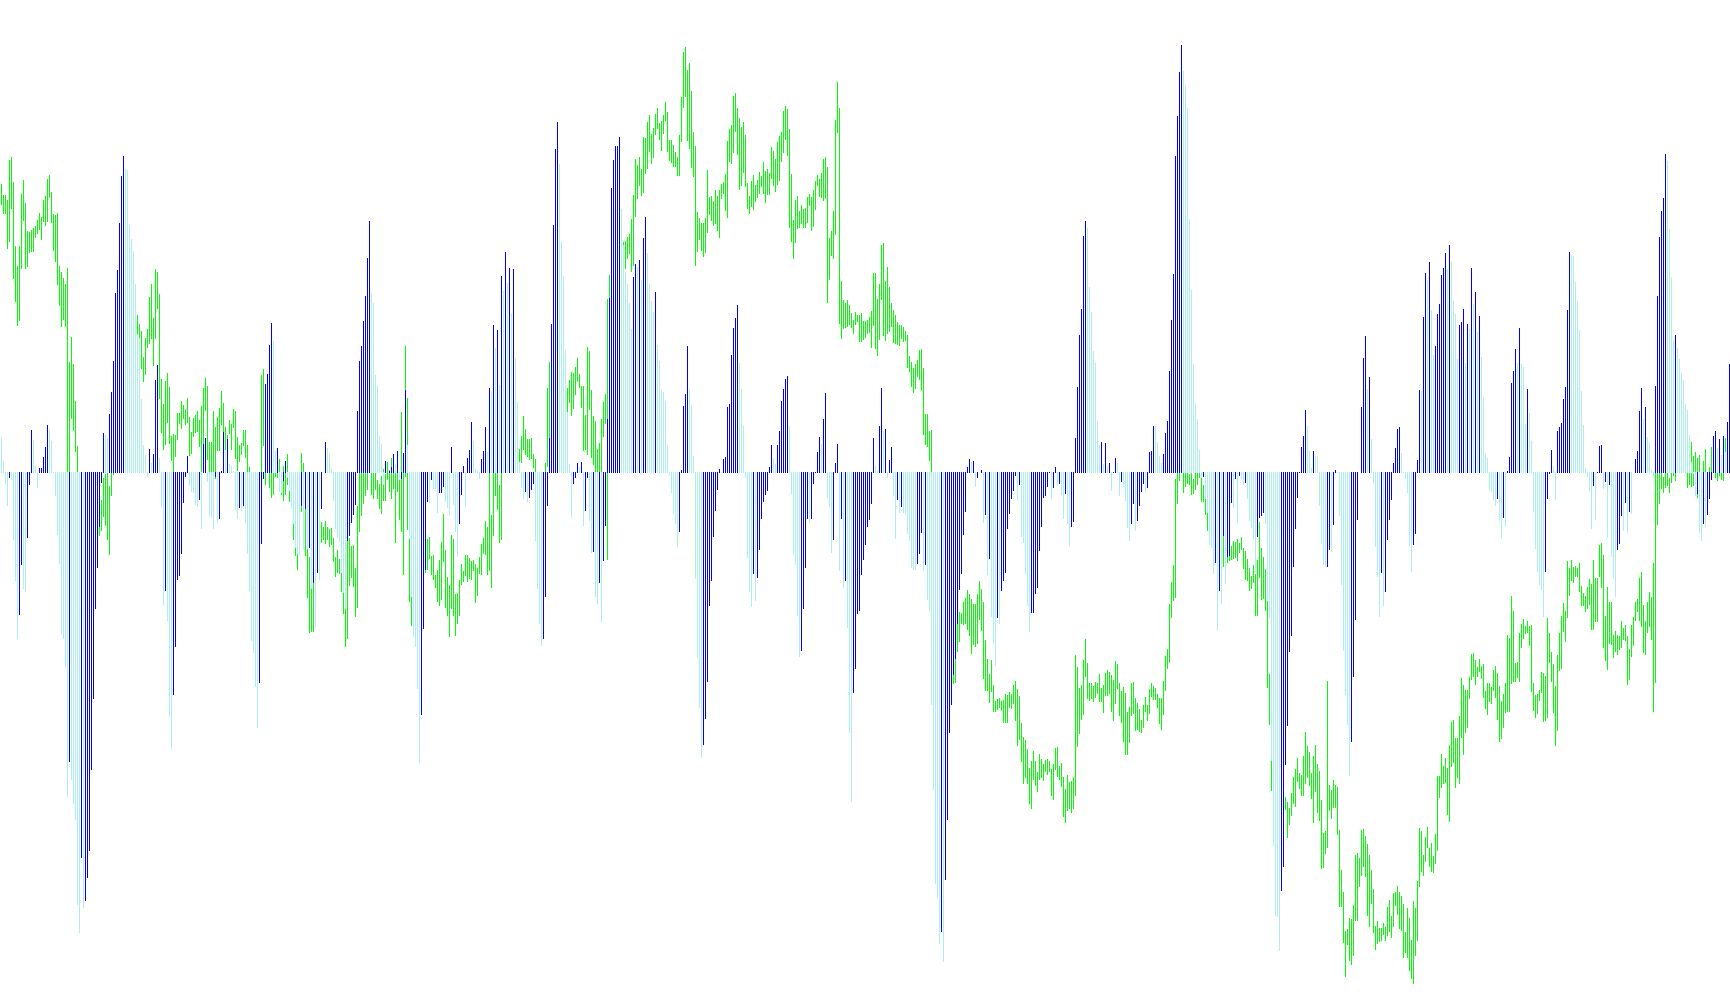
This technical indicator is designed to provide a visual representation of market momentum by analyzing price movement and volume characteristics over a specific rolling window of time. Instead of looking at individual price candles in isolation, it evaluates the collective "strength" of the market over a user-defined period.
How the Logic Works
1. Data Accumulation (The Rolling Window) The script looks backward at a set number of previous bars (defined by the "ExPeriod" setting). It scans this window to calculate two primary values: the total upward movement (positive price action) and the total downward movement (negative price action). By comparing these two totals, the tool identifies which direction the market has favored over that specific timeframe.
2. Momentum Calculation To determine the current sentiment, the logic subtracts the negative movement from the positive movement. This gives a "net" value of the price direction. This net value is then weighted and combined with historical data from the indicator's own previous calculations to smooth out sudden spikes and provide a more consistent trend line.
3. Normalization and Smoothing The script includes a normalization process. This ensures that the resulting values remain within a readable scale, preventing extreme price swings from distorting the visual display. It takes the current momentum and averages it against a small set of previous results to ensure that the movement displayed on your screen is fluid rather than erratic.
4. Visual Representation (The Histogram) The final output is divided into two distinct components displayed as a histogram:
- Positive Momentum: When the current calculated strength is higher than the previous period, it suggests increasing momentum in the prevailing direction.
- Negative Momentum: When the calculated strength drops below the previous period, it signals a cooling off or a reversal in that momentum.
Summary for the Trader
Essentially, this tool acts as a "momentum tracker." Rather than showing you every tiny price tick, it summarizes the "weight" of the market movement over a specific history (e.g., the last 6 bars). It helps you visualize whether the current trend is gaining strength, losing steam, or shifting direction by highlighting the net difference between buying and selling pressure.
//+------------------------------------------------------------------+
//|                                                 ExVolBars_v2.mq4 |
//|                           Copyright © 2006, Alex Sidd (Executer) |
//|                                       http://www.metaquotes.net/ |
//+------------------------------------------------------------------+
#property copyright "Copyright © 2006, Alex Sidd (Executer)"
#property link      "mailto:work_st@mail.ru"
//----
#property indicator_separate_window
#property indicator_buffers 3
#property  indicator_color1  Black
#property  indicator_color2  Blue
#property  indicator_color3  Red
//---- input parameters
extern int ExPeriod = 6;
extern int Normalize = 3;
//---- buffers
double VolBuffer[];
double PosBuffer[];
double NegBuffer[];
double pos;
//+------------------------------------------------------------------+
//| initialization function                                          |
//+------------------------------------------------------------------+
int init()
  {
   string short_name;
   IndicatorBuffers(3);
   SetIndexStyle(0, DRAW_NONE);
   SetIndexBuffer(0, VolBuffer);
   SetIndexStyle(1, DRAW_HISTOGRAM);
   SetIndexBuffer(1, PosBuffer);
   SetIndexStyle(2, DRAW_HISTOGRAM);
   SetIndexBuffer(2, NegBuffer);
   SetIndexDrawBegin(0, ExPeriod);
   SetIndexDrawBegin(1, ExPeriod);
   SetIndexDrawBegin(2, ExPeriod);
//----
   SetIndexLabel(1, NULL);
   SetIndexLabel(2, NULL);
//----
   short_name="ExVolBars(" + ExPeriod + ")";
   IndicatorShortName(short_name);
   SetIndexLabel(0, short_name);
//----
   return(0);
  }
//+------------------------------------------------------------------+
//| Executer Vol Indicator                                           |
//+------------------------------------------------------------------+
int start()
  {
   int    i, counted_bars = IndicatorCounted();
   double negative = 0, positive = 0;
//----
   if(Bars <= ExPeriod)
       return(0);
   if(counted_bars < 1)
       for(i = 1; i <= ExPeriod; i++)
           VolBuffer[Bars-i] = 0.0;
//----
   i = Bars - ExPeriod - 1;
   if(counted_bars >= ExPeriod)
       i = Bars -counted_bars - 1;
   while(i >= 0)
     {
       negative = 0;
       positive = 0;
       if(i < Bars - ExPeriod - 1)
         {
           int k = i + ExPeriod;
           while(k >= i)
             {
               if(Open[k] < Close[k])
                   positive += (Close[k] - Open[k]);
               if(Open[k] > Close[k])
                   negative += (Open[k] - Close[k]);
               if(Open[k] == Close[k])
                   {
                     negative += 0;
                     positive += 0;
                   }
               k--;
             }
         }
       double poss = 0;
       if(Normalize < 1)
           Normalize = 1;
       if(Normalize > 1000)
           Normalize = 1000;
       for(int j = 1; j != Normalize; j++)
         {
           poss += VolBuffer[i+j];
         }
       pos = (poss + ((positive - negative)*3000)) / Normalize;
       if(VolBuffer[i+1] < pos)
           PosBuffer[i] = pos;
       if(VolBuffer[i+1] > pos)
           NegBuffer[i]=pos;
       VolBuffer[i]=pos;
       i--;
     }
//----
   return(0);
  }
//+------------------------------------------------------------------+
Comments