EntropyMath_ofMA
Download script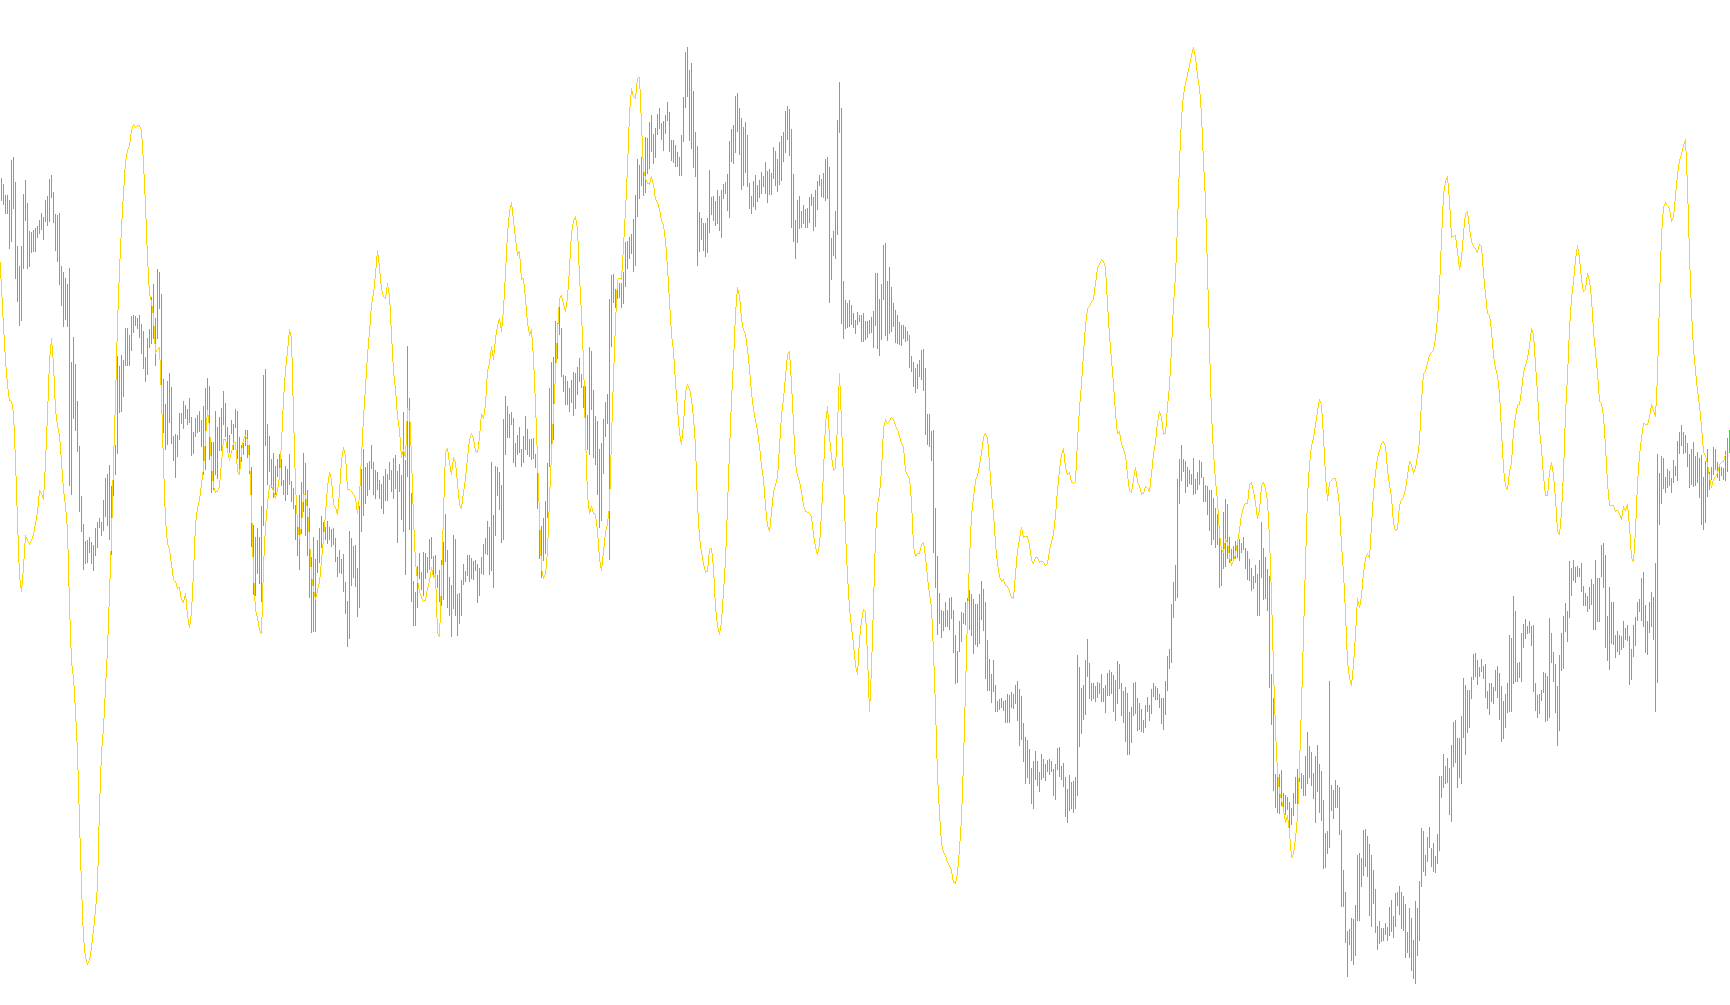
This tool is designed to analyze market behavior by measuring "Entropy," which in financial terms refers to the level of disorder, randomness, or predictability within price movements. Instead of looking at raw price directly, the script processes data to determine how much "noise" exists in the market versus a clear trend.
How the Logic Works
1. Data Smoothing and Preparation Before calculating any complexity, the script first applies a Moving Average (MA) to the price data. This acts as a filter to smooth out minor fluctuations, allowing the tool to focus on the underlying momentum rather than every tiny tick of the market. You can customize how this smoothing behaves—choosing different periods and methods (like Simple or Exponential averages)—to suit your specific trading style.
2. Measuring Relative Change The script looks at a specific number of previous data points (defined by the "numbars" setting). It compares the value of one moving average point to the next one. By calculating the logarithmic ratio between these two points, the tool creates a mathematical representation of the "jump" or "shift" in price.
3. Statistical Analysis (Average and Variation) Once it has these relative changes, the script performs two main calculations:
- The Average: It finds the mean shift over your chosen period.
- The Root Mean Square (Variation): It calculates how much the price fluctuates away from that average. This helps the tool distinguish between a steady, consistent trend and a wild, erratic one.
4. The Entropy Calculation Finally, the script combines these two values—the average shift and the variation—using a specific mathematical formula to produce an Entropy value.
- If the market is moving in a very organized, predictable way, the entropy level will reflect that stability.
- If the market becomes highly erratic, disorganized, or volatile without a clear direction, the entropy level will change accordingly.
What This Means for the User
The result is displayed as a line on a separate window in your trading platform. By observing this line, you can gauge the "health" of the current market trend. It helps identify periods of high uncertainty (high entropy/disorder) versus periods of relative calm or structural clarity. It essentially translates complex price volatility into a single, readable indicator that tells you how organized the market currently is.
//+------------------------------------------------------------------+
//|                                                  EntropyMath.mq4 |
//|                                         Aleksandr Pak            |
//+------------------------------------------------------------------+

#property  copyright "Copyright © 2008, MetaQuotes Software Corp."
#property  link      "http://forum.mql4.com/ru/13708"
#property indicator_separate_window

#property indicator_buffers 1
#property indicator_color1 Red
#property indicator_level1 0.0001
#property indicator_level2 -0.0001

double entropy[];

extern int numbars=14;
extern int ma_period=5;
extern int ma_mode=1;
extern int ma_price=5;
extern string   note_Price = "0C 1O 2H 3L 4Md 5Tp 6WghC: Md(HL/2)4,Tp(HLC/3)5,Wgh(HLCC/4)6";
extern string   MA_Method_ = "SMA0 EMA1 SMMA2 LWMA3";

//+------------------------------------------------------------------+
int init()
{
	SetIndexBuffer(0,entropy); SetIndexStyle(0,DRAW_LINE);
	IndicatorShortName("Entropy("+numbars+") MA("+ma_period+") " );
	IndicatorDigits(3*Digits);
	return(0);
}
//+------------------------------------------------------------------+
int deinit() { return(0); }
//+------------------------------------------------------------------+
int start ()
{
	double  P, G;
	int in, out;
	int i,j;
	double sumx = 0.0;
	double sumx2 = 0.0;
	double avgx = 0.0;
	double rmsx = 0.0;

	in=0;  //price;
	out=0; //entropy;
	int count = IndicatorCounted();

	for (i=0; i<Bars-count+1; i++)
	{
		if (i>Bars-numbars+1) entropy[out] = EMPTY_VALUE;
		else
		{
			sumx = 0; sumx2=0 ; avgx =0; rmsx = 0.0;
			for (j=0;j<numbars+1;j++)
			{
			double   a =iMA(NULL,0,ma_period,0,ma_mode,ma_price,in+j);
			double	b =iMA(NULL,0,ma_period,0,ma_mode,ma_price,in+j+1);
				double r=MathLog(a / b) ;
				sumx += r;
				sumx2 += r * r;
			}
		if (numbars==0)  {
		double c=iMA(NULL,0,ma_period,0,ma_mode,ma_price,in);
		avgx = c; rmsx = 0.0; }
		else  { avgx = sumx / numbars; rmsx = MathSqrt(sumx2/numbars); }
		P = ((avgx/rmsx)+1)/2.0;
		G = P * MathLog(1+rmsx) + (1-P) * MathLog(1-rmsx);
		entropy[out]=G;
	}
	in++; out++;
	}
}
Comments