EMAAngleZero_v3
Download script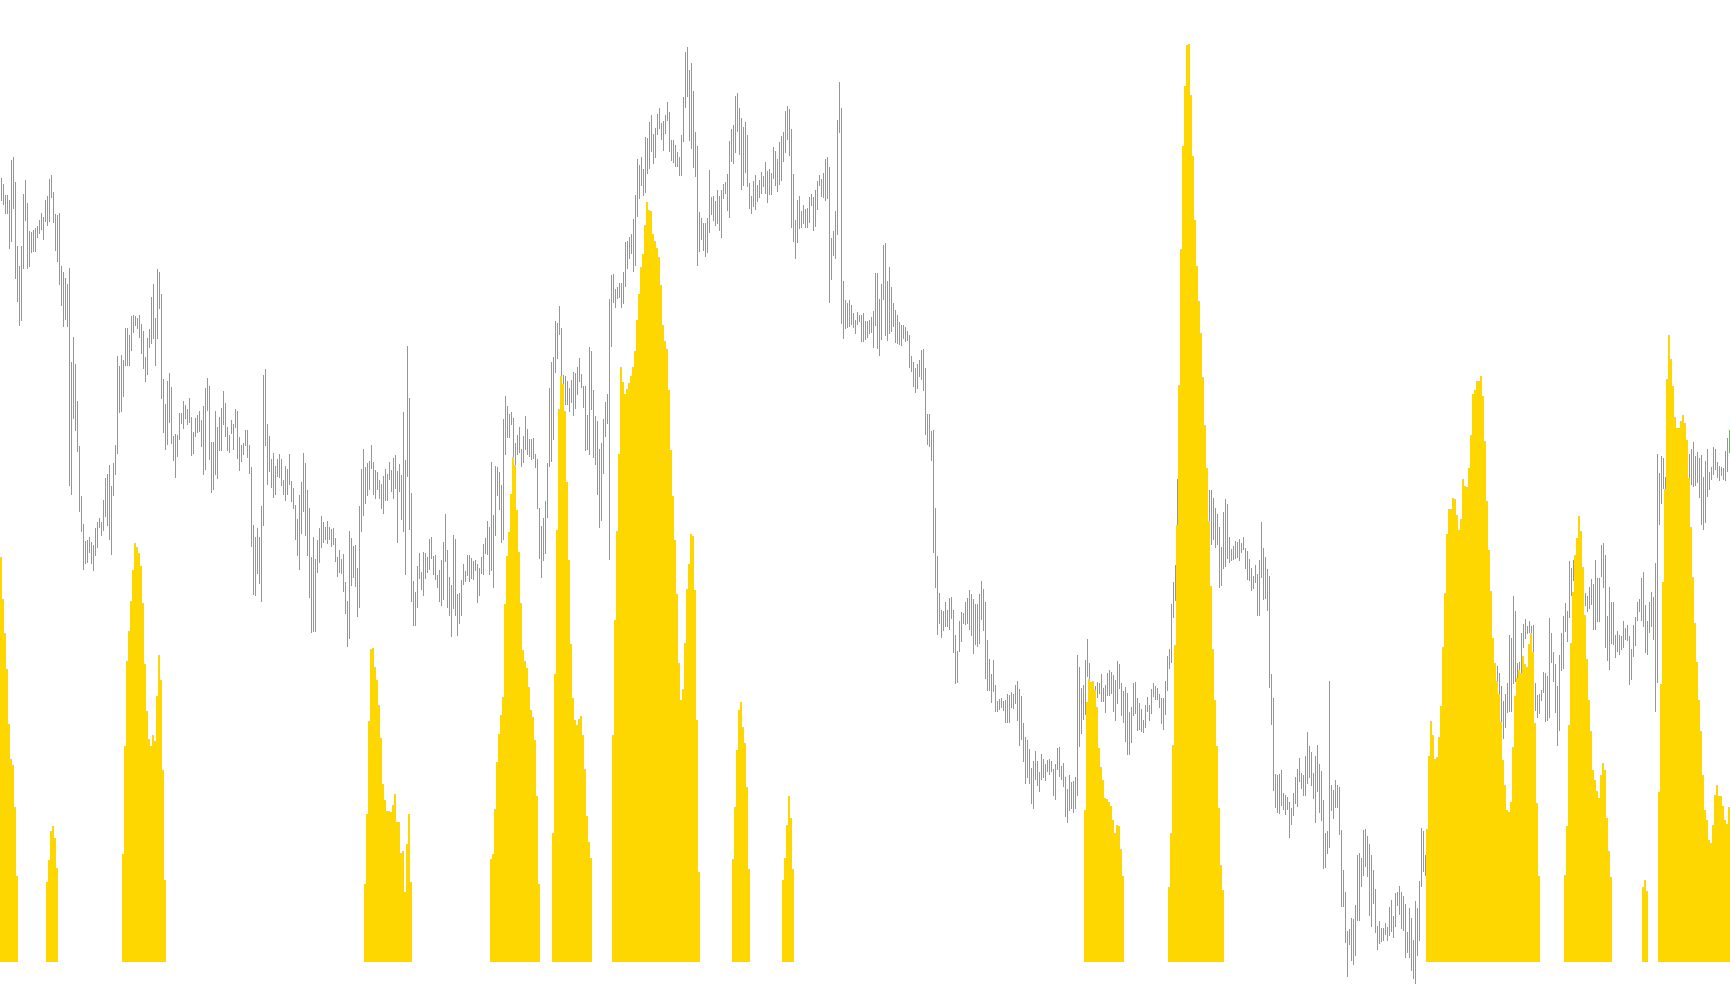
This tool is designed to help traders visualize the momentum and direction of a specific moving average (the Exponential Moving Average, or EMA) by calculating its "angle" relative to the price chart. Rather than just showing you where the average price is, this script measures how sharply that average is tilting up, down, or staying flat.
How the Logic Works
1. Measuring the Tilt (The Angle) The script looks at two specific points on the EMA line: a starting point in the past and an ending point closer to the present. By comparing the price difference between these two points over a set distance, the tool calculates a numerical value representing the "slope" of the trend.
2. Normalizing the Data To ensure the readings are consistent across different types of currency pairs (like USD/JPY vs. others), the script applies a mathematical scaling factor. This prevents the angle from appearing too small to see on your screen, making the visual data much easier to interpret at a glance.
3. The Three Trend States The indicator categorizes the movement into three distinct visual zones based on a user-defined threshold. It interprets the "angle" in the following ways:
- Bullish Momentum (Green): If the angle is significantly positive (higher than your chosen threshold), the tool identifies a strong upward trend.
- Bearish Momentum (Red): If the angle is significantly negative (lower than your chosen negative threshold), the tool identifies a strong downward trend.
- Neutral/Consolidation (Yellow): If the angle falls between these two thresholds, it means the EMA is "near zero." This indicates that the market is sideways, ranging, or lacking a clear directional trend at that moment.
Key Takeaways for the User
By observing the histogram produced by this script, you can quickly identify periods of high-energy movement versus periods of stagnation. It acts as a visual filter to help you distinguish between a trending market (where you might look for entries) and a flat market (where trend-following strategies may be less effective).
//+------------------------------------------------------------------+
//|                                                     EMAAngle.mq4 |
//|                                                           jpkfox |
//|                                                                  |
//| You can use this indicator to measure when the EMA angle is      |
//| "near zero". AngleTreshold determines when the angle for the     |
//| EMA is "about zero": This is when the value is between           |
//| [-AngleTreshold, AngleTreshold] (or when the histogram is red).  |
//|   EMAPeriod: EMA period                                          |
//|   AngleTreshold: The angle value is "about zero" when it is      |
//|     between the values [-AngleTreshold, AngleTreshold].          |
//|   StartEMAShift: The starting point to calculate the             |
//|     angle. This is a shift value to the left from the            |
//|     observation point. Should be StartEMAShift > EndEMAShift.    |
//|   StartEMAShift: The ending point to calculate the               |
//|     angle. This is a shift value to the left from the            |
//|     observation point. Should be StartEMAShift > EndEMAShift.    |
//|                                                                  |
//|   Modified by MrPip                                              |
//|       Red for down                                               |
//|       Yellow for near zero                                       |
//|       Green for up                                               |
//|  10/15/05  MrPip                                                 |
//|            Corrected problem with USDJPY and optimized code      |
//|                                                                  |
//+------------------------------------------------------------------+
#property  copyright "jpkfox"
#property  link      "http://www.strategybuilderfx.com/forums/showthread.php?t=15274&page=1&pp=8"
//---- indicator settings
#property  indicator_separate_window
#property  indicator_buffers 3
#property  indicator_color1  LimeGreen
#property  indicator_color2  Yellow
#property  indicator_color3 FireBrick
//---- indicator parameters
extern int EMAPeriod=34;
extern double AngleTreshold=0.2;
extern int StartEMAShift=6;
extern int EndEMAShift=0;
//---- indicator buffers
double UpBuffer[];
double DownBuffer[];
double ZeroBuffer[];
//+------------------------------------------------------------------+
//| Custom indicator initialization function                         |
//+------------------------------------------------------------------+
int init()
  {
//---- 2 additional buffers are used for counting.
   IndicatorBuffers(3);
//---- drawing settings
   SetIndexStyle(0,DRAW_HISTOGRAM,STYLE_SOLID,2);
   SetIndexStyle(1,DRAW_HISTOGRAM,STYLE_SOLID,2);
   SetIndexStyle(2,DRAW_HISTOGRAM,STYLE_SOLID,2);
//----
   IndicatorDigits(MarketInfo(Symbol(),MODE_DIGITS)+2);
//---- 3 indicator buffers mapping
   if(!SetIndexBuffer(0,UpBuffer) &&
      !SetIndexBuffer(1,DownBuffer) &&
      !SetIndexBuffer(2,ZeroBuffer))
      Print("cannot set indicator buffers!");
//---- name for DataWindow and indicator subwindow label
   IndicatorShortName("EMAAngleZero("+EMAPeriod+","+AngleTreshold+","+StartEMAShift+","+EndEMAShift+")");
//---- initialization done
   return(0);
  }
//+------------------------------------------------------------------+
//| The angle for EMA                                                |
//+------------------------------------------------------------------+
int start()
  {
   double fEndMA, fStartMA;
   double fAngle, mFactor, dFactor;
   int nLimit, i;
   int nCountedBars;
   double angle;
   int ShiftDif;
   if(EndEMAShift>=StartEMAShift)
     {
      Print("Error: EndEMAShift >= StartEMAShift");
      StartEMAShift=6;
      EndEMAShift=0;
     }
   nCountedBars=IndicatorCounted();
//---- check for possible errors
   if(nCountedBars<0)
      return(-1);
//---- last counted bar will be recounted
   if(nCountedBars>0)
      nCountedBars--;
//----
   nLimit=Bars-nCountedBars;
//----
   dFactor=3.14159/180.0;
   mFactor=10000.0;
   if (Symbol()=="USDJPY") mFactor=100.0;
   ShiftDif=StartEMAShift-EndEMAShift;
   mFactor/=ShiftDif;
//---- main loop
   for(i=0; i<nLimit; i++)
     {
      fEndMA=iMA(NULL,0,EMAPeriod,0,MODE_EMA,PRICE_MEDIAN,i+EndEMAShift);
      fStartMA=iMA(NULL,0,EMAPeriod,0,MODE_EMA,PRICE_MEDIAN,i+StartEMAShift);
      // 10000.0 : Multiply by 10000 so that the fAngle is not too small
      // for the indicator Window.
      fAngle=mFactor * (fEndMA - fStartMA);
      //      fAngle = MathArctan(fAngle)/dFactor;
      DownBuffer[i]=0.0;
      UpBuffer[i]=0.0;
      ZeroBuffer[i]=0.0;
//----
      if(fAngle > AngleTreshold)
         UpBuffer[i]=fAngle;
      else if (fAngle < -AngleTreshold)
            DownBuffer[i]=fAngle;
         else ZeroBuffer[i]=fAngle;
     }
   return(0);
  }
//+------------------------------------------------------------------+
Comments