EMAAngle
Download script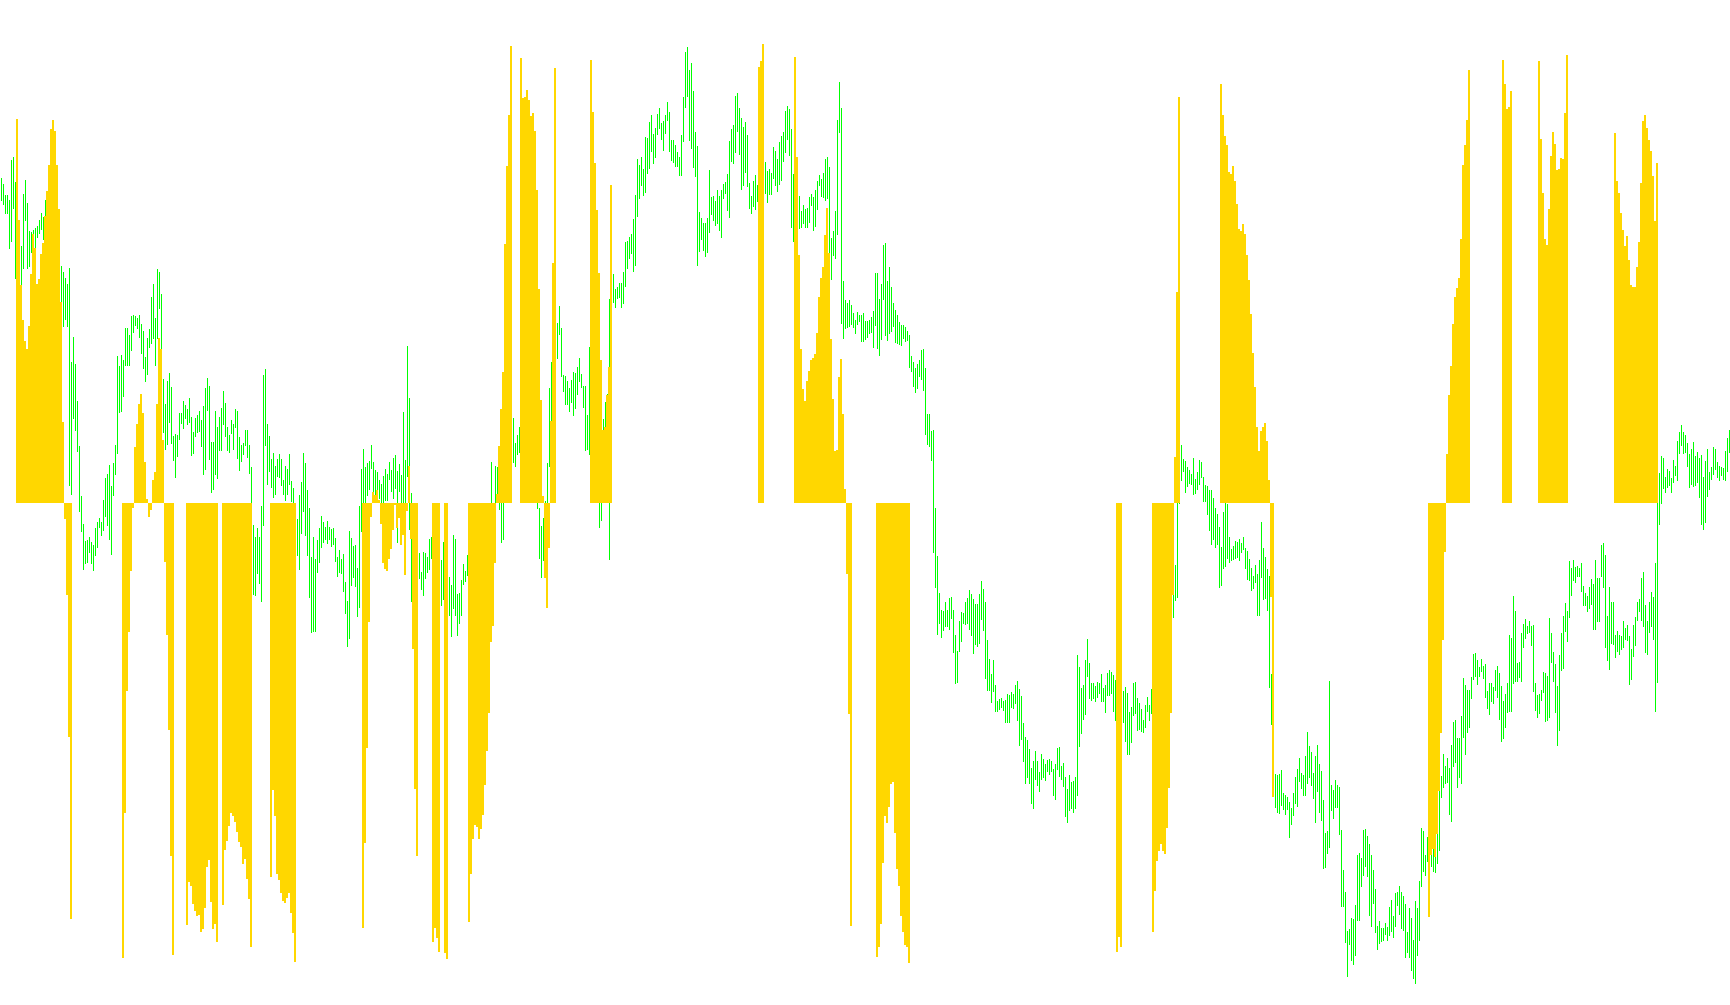
This tool is designed to help traders identify specific moments in the market where an Exponential Moving Average (EMA) becomes relatively "flat" or horizontal. In technical analysis, a flat moving average often suggests a period of consolidation or a lack of clear direction, while a steep angle indicates strong momentum.
How the Logic Works
The script operates by calculating the slope of an EMA over a specific distance on your price chart. Here is the step-by-step breakdown of its internal logic:
1. Measuring the Slope Instead of looking at just one point in time, the tool looks at two different points on the EMA line. It takes the value at the current position (the end) and compares it to a previous position (the start). By measuring the difference in price between these two points over a set number of bars, the script calculates the "angle" or steepness of the trend.
2. Sensitivity Adjustment Because raw price movements can result in very small numerical changes, the tool applies a multiplier to the calculation. This ensures that the resulting angle is large enough to be visible and meaningful on your trading platform's indicator window.
3. The "Near Zero" Detection (The Threshold) This is the core functionality of the script. The user can define a specific "Angle Threshold."
- If the calculated angle falls within this threshold (meaning it is very close to zero), the tool identifies that the trend is flattening out.
- If the angle is outside of this threshold (either much higher or much lower), it indicates that the trend still possesses significant momentum.
4. Visual Representation The tool translates these calculations into a histogram in a separate window:
- When the EMA is moving aggressively enough to exceed your set threshold, the script plots the angle value.
- When the EMA enters that "near zero" zone (the flat area), it highlights that specific behavior differently.
Summary for the Trader
By using this logic, you can visually monitor when a trend is losing steam. Rather than guessing if a moving average is "flat enough" to signal a reversal or a breakout, this tool provides a mathematical confirmation, highlighting exactly when the momentum of the EMA drops into a neutral zone.
//+------------------------------------------------------------------+
//|                                                     EMAAngle.mq4 |
//|                                                           jpkfox |
//|                                                                  |
//| You can use this indicator to measure when the EMA angle is      |
//| "near zero". AngleTreshold determines when the angle for the     |
//| EMA is "about zero": This is when the value is between           |
//| [-AngleTreshold, AngleTreshold] (or when the histogram is red).  |
//|   EMAPeriod: EMA period                                          |
//|   AngleTreshold: The angle value is "about zero" when it is      |
//|     between the values [-AngleTreshold, AngleTreshold].          |
//|   StartEMAShift: The starting point to calculate the             |
//|     angle. This is a shift value to the left from the            |
//|     observation point. Should be StartEMAShift > EndEMAShift.    |
//|   StartEMAShift: The ending point to calculate the               |
//|     angle. This is a shift value to the left from the            |
//|     observation point. Should be StartEMAShift > EndEMAShift.    |
//|                                                                  |
//+------------------------------------------------------------------+

#property  copyright "jpkfox"
#property  link      "http://www.strategybuilderfx.com/forums/showthread.php?t=15274&page=1&pp=8"
//---- indicator settings
#property  indicator_separate_window
#property  indicator_buffers 2
#property  indicator_color1  FireBrick
#property  indicator_color2  LimeGreen
//---- indicator parameters
extern int EMAPeriod=120;
extern double AngleTreshold=0.32;
extern int StartEMAShift=6;
extern int EndEMAShift=0;

//---- indicator buffers
double UpBuffer[];
double DownBuffer[];

//+------------------------------------------------------------------+
//| Custom indicator initialization function                         |
//+------------------------------------------------------------------+
int init()
{
//---- 2 additional buffers are used for counting.
   IndicatorBuffers(2);
//---- drawing settings
   SetIndexStyle(0,DRAW_HISTOGRAM,STYLE_SOLID,2);
   SetIndexStyle(1,DRAW_HISTOGRAM,STYLE_SOLID,2);
   IndicatorDigits(MarketInfo(Symbol(),MODE_DIGITS)+2);
//---- 3 indicator buffers mapping
   if(!SetIndexBuffer(0,UpBuffer) &&
      !SetIndexBuffer(1,DownBuffer))
      Print("cannot set indicator buffers!");
//---- name for DataWindow and indicator subwindow label
   IndicatorShortName("EMAAngle("+EMAPeriod+","+AngleTreshold+","+StartEMAShift+","+EndEMAShift+")");
//---- initialization done
   return(0);
}
//+------------------------------------------------------------------+
//| The angle for EMA                                                |
//+------------------------------------------------------------------+
int start()
{
   double fEndMA, fStartMA;
   double fAngle;
   int nLimit, i;
   int nCountedBars;

   if(EndEMAShift >= StartEMAShift)
   {
      Print("Error: EndEMAShift >= StartEMAShift");
      StartEMAShift = 6;
      EndEMAShift = 0;
   }

   nCountedBars = IndicatorCounted();
//---- check for possible errors
   if(nCountedBars<0)
      return(-1);
//---- last counted bar will be recounted
   if(nCountedBars>0)
      nCountedBars--;
   nLimit = Bars-nCountedBars;

//---- main loop
   for(i=0; i<nLimit; i++)
   {
      fEndMA=iMA(NULL,0,EMAPeriod,0,MODE_EMA,PRICE_MEDIAN,i+EndEMAShift);
      fStartMA=iMA(NULL,0,EMAPeriod,0,MODE_EMA,PRICE_MEDIAN,i+StartEMAShift);
      // 10000.0 : Multiply by 10000 so that the fAngle is not too small
      // for the indicator Window.
      fAngle = 10000.0 * (fEndMA - fStartMA)/(StartEMAShift-EndEMAShift);

      DownBuffer[i] = 0.0;
      UpBuffer[i] = 0.0;

      if(fAngle > AngleTreshold || fAngle < -AngleTreshold)
         DownBuffer[i] = fAngle;
      else
         UpBuffer[i] = fAngle;
   }

   return(0);
  }
//+------------------------------------------------------------------+
Comments