EMAAngle_v1
Download script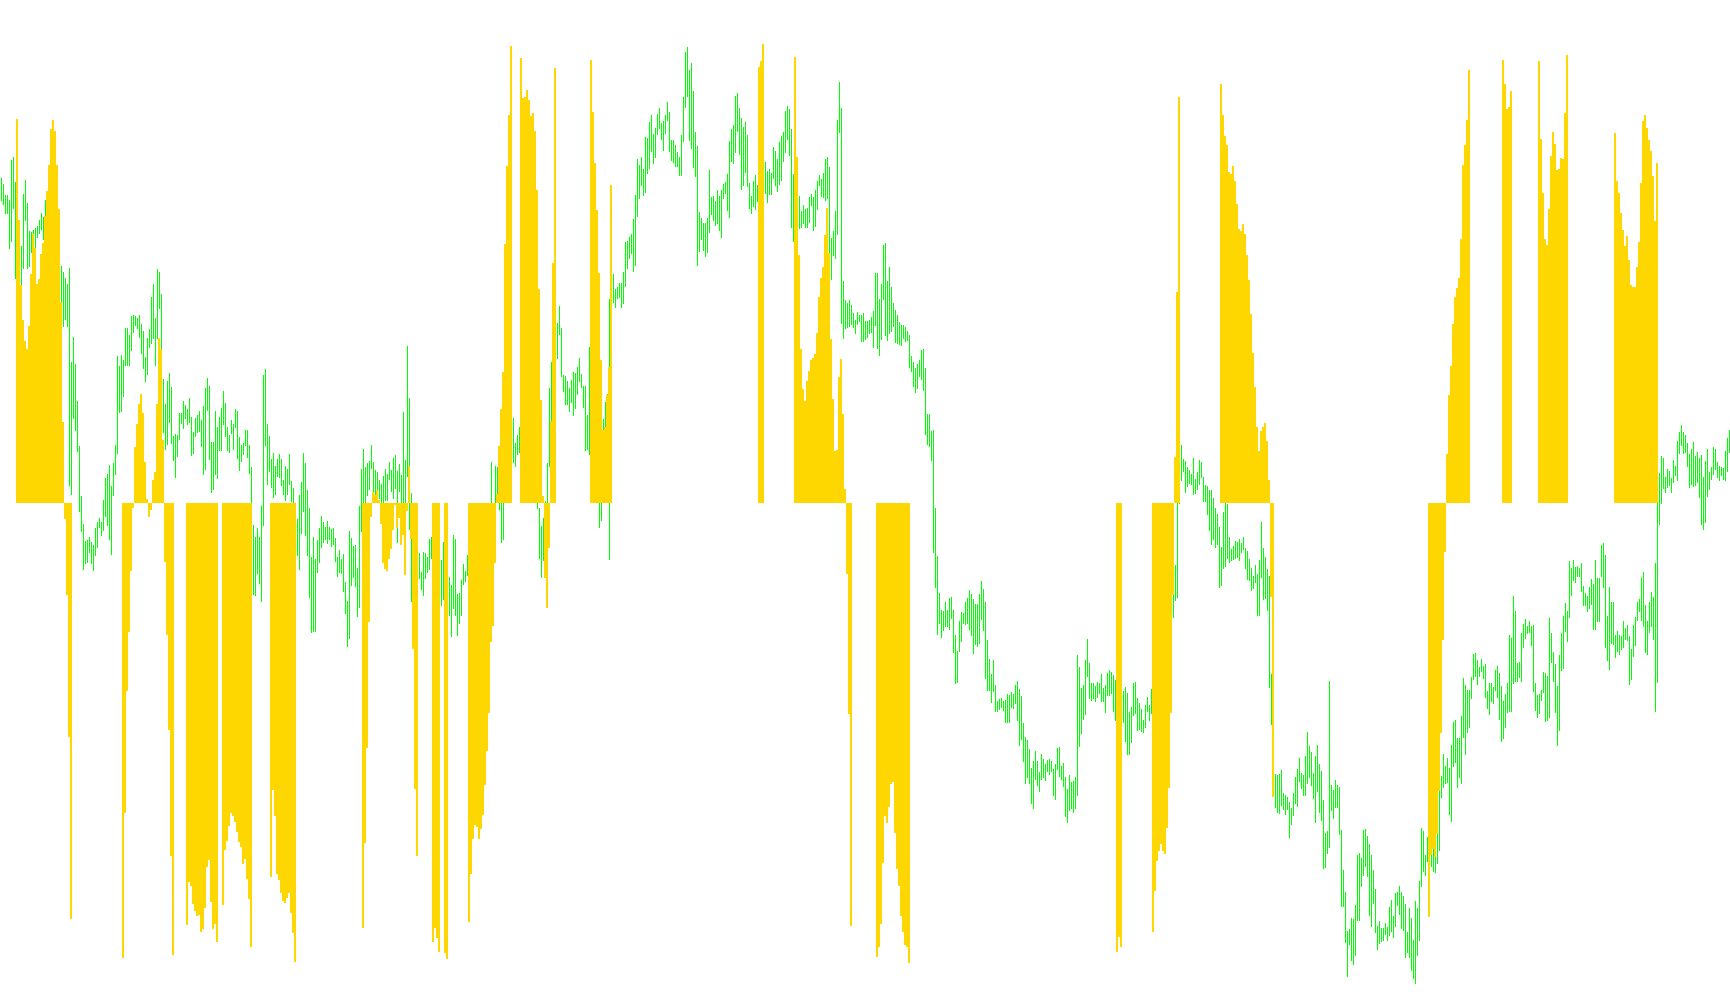
This tool is designed to help traders visualize the momentum and "steepness" of a specific moving average, specifically looking for moments when the market trend goes flat or enters a period of consolidation.
How it Works
The indicator focuses on the EMA (Exponential Moving Average), which is a common technical line used to smooth out price fluctuations. Instead of just showing you the line itself, this script measures the angle at which that line is moving over a specific distance in time.
Key Logic Components:
- Angle Measurement: The script looks back at two different points on the EMA (defined by your "Start" and "End" shifts). By calculating the difference in value between these two points relative to the time passed, it determines how sharply the line is rising or falling.
- The "Near Zero" Detection: The primary purpose of this tool is to identify when the EMA becomes "flat." It uses a specific threshold (the Angle Threshold) to act as a filter.
- If the angle of the EMA is very small (falling within your specified limit of "near zero"), it signals that the trend is losing momentum or moving sideways.
- If the angle is significantly higher or lower than that limit, it indicates a stronger, more active trend.
- Visual Representation: The indicator translates these calculations into a histogram in a separate window:
- Neutral/Flat Zones: When the EMA angle is within your "near zero" threshold, it identifies a lack of strong directional movement.
- Active Trend Zones: When the angle exceeds your threshold (moving sharply up or down), the histogram reflects that stronger movement.
Summary for the Trader
Essentially, this script acts as a momentum thermometer. It helps you filter out "choppy" markets by highlighting where the moving average is struggling to move significantly in one direction. By identifying these "near zero" angles, traders can better recognize periods of equilibrium or potential trend reversals before they become obvious on the main price chart.
/*-----------------------------+
|			       |
| Shared by www.Aptrafx.com    |
|			       |
+------------------------------*/

//+------------------------------------------------------------------+
//|                                                     EMAAngle.mq4 |
//|                                                           jpkfox |
//|                                                                  |
//| You can use this indicator to measure when the EMA angle is      |
//| "near zero". AngleTreshold determines when the angle for the     |
//| EMA is "about zero": This is when the value is between           |
//| [-AngleTreshold, AngleTreshold] (or when the histogram is red).  |
//|   EMAPeriod: EMA period                                          |
//|   AngleTreshold: The angle value is "about zero" when it is      |
//|     between the values [-AngleTreshold, AngleTreshold].          |
//|   StartEMAShift: The starting point to calculate the             |
//|     angle. This is a shift value to the left from the            |
//|     observation point. Should be StartEMAShift > EndEMAShift.    |
//|   StartEMAShift: The ending point to calculate the               |
//|     angle. This is a shift value to the left from the            |
//|     observation point. Should be StartEMAShift > EndEMAShift.    |
//|                                                                  |
//+------------------------------------------------------------------+

#property  copyright "jpkfox"
#property  link      "http://www.strategybuilderfx.com/forums/showthread.php?t=15274&page=1&pp=8"
//---- indicator settings
#property  indicator_separate_window
#property  indicator_buffers 2
#property  indicator_color1  FireBrick
#property  indicator_color2  LimeGreen
//---- indicator parameters
extern int EMAPeriod=120;
extern double AngleTreshold=0.32;
extern int StartEMAShift=6;
extern int EndEMAShift=0;

//---- indicator buffers
double UpBuffer[];
double DownBuffer[];

//+------------------------------------------------------------------+
//| Custom indicator initialization function                         |
//+------------------------------------------------------------------+
int init()
{
//---- 2 additional buffers are used for counting.
   IndicatorBuffers(2);
//---- drawing settings
   SetIndexStyle(0,DRAW_HISTOGRAM,STYLE_SOLID,2);
   SetIndexStyle(1,DRAW_HISTOGRAM,STYLE_SOLID,2);
   IndicatorDigits(MarketInfo(Symbol(),MODE_DIGITS)+2);
//---- 3 indicator buffers mapping
   if(!SetIndexBuffer(0,UpBuffer) &&
      !SetIndexBuffer(1,DownBuffer))
      Print("cannot set indicator buffers!");
//---- name for DataWindow and indicator subwindow label
   IndicatorShortName("EMAAngle("+EMAPeriod+","+AngleTreshold+","+StartEMAShift+","+EndEMAShift+")");
//---- initialization done
   return(0);
}
//+------------------------------------------------------------------+
//| The angle for EMA                                                |
//+------------------------------------------------------------------+
int start()
{
   double fEndMA, fStartMA;
   double fAngle;
   int nLimit, i;
   int nCountedBars;

   if(EndEMAShift >= StartEMAShift)
   {
      Print("Error: EndEMAShift >= StartEMAShift");
      StartEMAShift = 6;
      EndEMAShift = 0;
   }

   nCountedBars = IndicatorCounted();
//---- check for possible errors
   if(nCountedBars<0)
      return(-1);
//---- last counted bar will be recounted
   if(nCountedBars>0)
      nCountedBars--;
   nLimit = Bars-nCountedBars;

//---- main loop
   for(i=0; i<nLimit; i++)
   {
      fEndMA=iMA(NULL,0,EMAPeriod,0,MODE_EMA,PRICE_MEDIAN,i+EndEMAShift);
      fStartMA=iMA(NULL,0,EMAPeriod,0,MODE_EMA,PRICE_MEDIAN,i+StartEMAShift);
      // 10000.0 : Multiply by 10000 so that the fAngle is not too small
      // for the indicator Window.
      fAngle = 10000.0 * (fEndMA - fStartMA)/(StartEMAShift-EndEMAShift);

      DownBuffer[i] = 0.0;
      UpBuffer[i] = 0.0;

      if(fAngle > AngleTreshold || fAngle < -AngleTreshold)
         DownBuffer[i] = fAngle;
      else
         UpBuffer[i] = fAngle;
   }

   return(0);
  }
//+------------------------------------------------------------------+
Comments