EMA_Pivot
Download script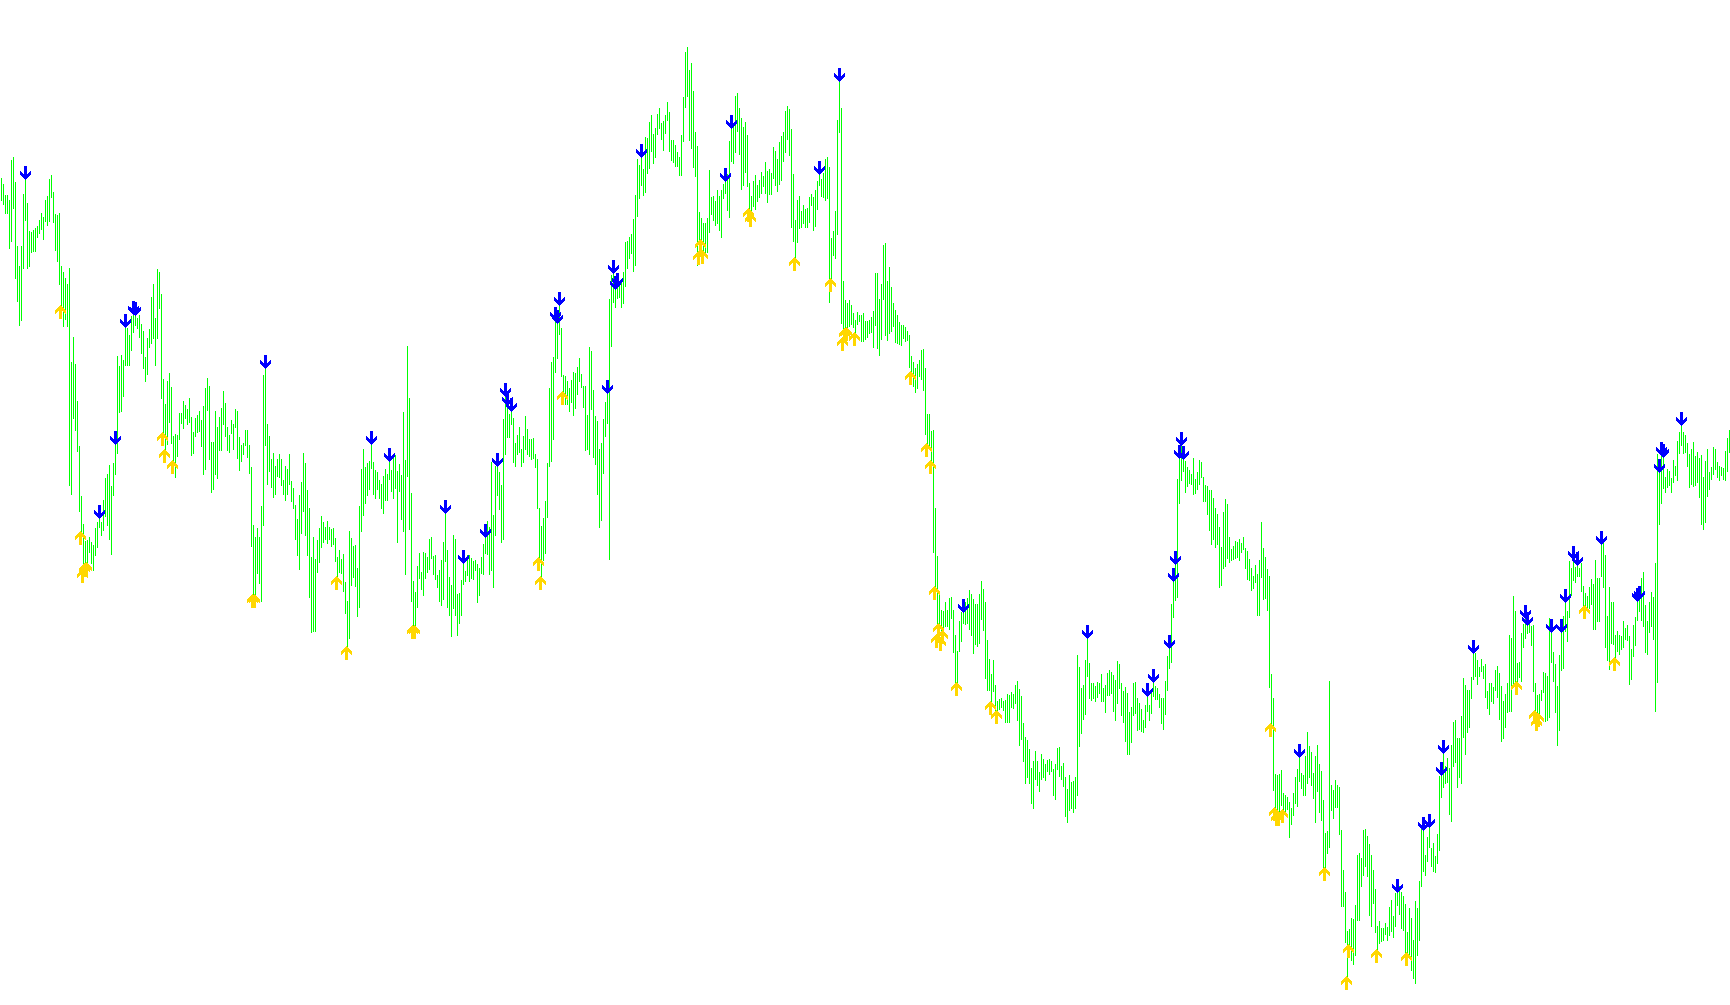
This tool is designed to help traders identify potential price action signals by monitoring the relationship between current price movements and a specific moving average. Rather than just showing a line on your chart, it acts as a visual alert system that places markers (arrows) at specific points where the price deviates significantly from its recent trend.
How the Logic Works
The script functions by continuously scanning historical and real-time price data to perform three main actions:
1. Trend Smoothing The tool calculates an Exponential Moving Average (EMA). This is a technical indicator that smooths out "noise" in the market to reveal the underlying trend. By using this as a baseline, the script can determine what the "normal" price level should be at any given moment.
2. Identifying Over-Extended Movements The core logic looks for instances where the price pushes significantly away from that moving average. It doesn't trigger on every minor wiggle; instead, it looks for specific gaps:
- Downward Pressure: If the current low of a candle is positioned notably higher than the moving average (plus a small defined buffer), the script recognizes a potential interaction.
- Upward Pressure: Conversely, if the current high of a candle is positioned notably lower than the moving average (minus a small defined buffer), it identifies an opposing movement.
3. Visual Signaling Once these specific conditions are met, the script provides immediate visual feedback on your chart:
- It places Blue markers below the price candles when the data suggests an upward sentiment or price recovery.
- It places Red markers above the price candles when the data suggests downward pressure.
Summary for Traders
In simple terms, this script acts as a "deviation detector." It highlights moments where the price is moving away from its average in a way that might be significant for your trading strategy. By highlighting these points with arrows, it allows you to quickly spot potential turning points or areas of interest without having to manually calculate the distance between the candles and the moving average yourself.
//+------------------------------------------------------------------+
//|                                                    EMA_Pivot.mq4 |
//|                                       Copyright © 2006, Akuma99. |
//|                                    http://www.beginnertrader.com |
//+------------------------------------------------------------------+
#property copyright "Copyright © 2006, Akuma99."
#property link      "http://www.beginnertrader.com"

#property indicator_chart_window
#property indicator_buffers 2
#property indicator_color1 Blue
#property indicator_color2 Red
//---- buffers
double ExtMapBuffer1[];
double ExtMapBuffer2[];
//+------------------------------------------------------------------+
//| Custom indicator initialization function                         |
//+------------------------------------------------------------------+
int init()
  {
//---- indicators
   SetIndexStyle(0,DRAW_ARROW);
   SetIndexArrow(0,233);
   SetIndexBuffer(0,ExtMapBuffer1);
   SetIndexEmptyValue(0,0.0);
   SetIndexStyle(1,DRAW_ARROW);
   SetIndexArrow(1,234);
   SetIndexBuffer(1,ExtMapBuffer2);
   SetIndexEmptyValue(1,0.0);
//----
   return(0);
  }
//+------------------------------------------------------------------+
//| Custom indicator deinitialization function                       |
//+------------------------------------------------------------------+
int deinit()
  {
//----

//----
   return(0);
  }
//+------------------------------------------------------------------+
//| Custom indicator iteration function                              |
//+------------------------------------------------------------------+
int start()
  {
   int    counted_bars=IndicatorCounted();
   int    limit=Bars-counted_bars;
   int    i;
//----

   for(i=0; i<limit; i++){

      clearBuffers(i);

      double ema1 = iMA(NULL,0,4,0,MODE_EMA,PRICE_CLOSE,i);

      if (Low[i] > ema1+5*Point) { // down

         ExtMapBuffer2[i] = High[i]+15*Point;

      } else if (High[i] < ema1-5*Point) { //up

         ExtMapBuffer1[i] = Low[i]-15*Point;

      }
   }

//----
   return(0);
  }
//+------------------------------------------------------------------+

void clearBuffers(int i) {

   ExtMapBuffer2[i] = NULL;
   ExtMapBuffer1[i] = NULL;

}
Comments