EMA Crossover Signal_v2
Download script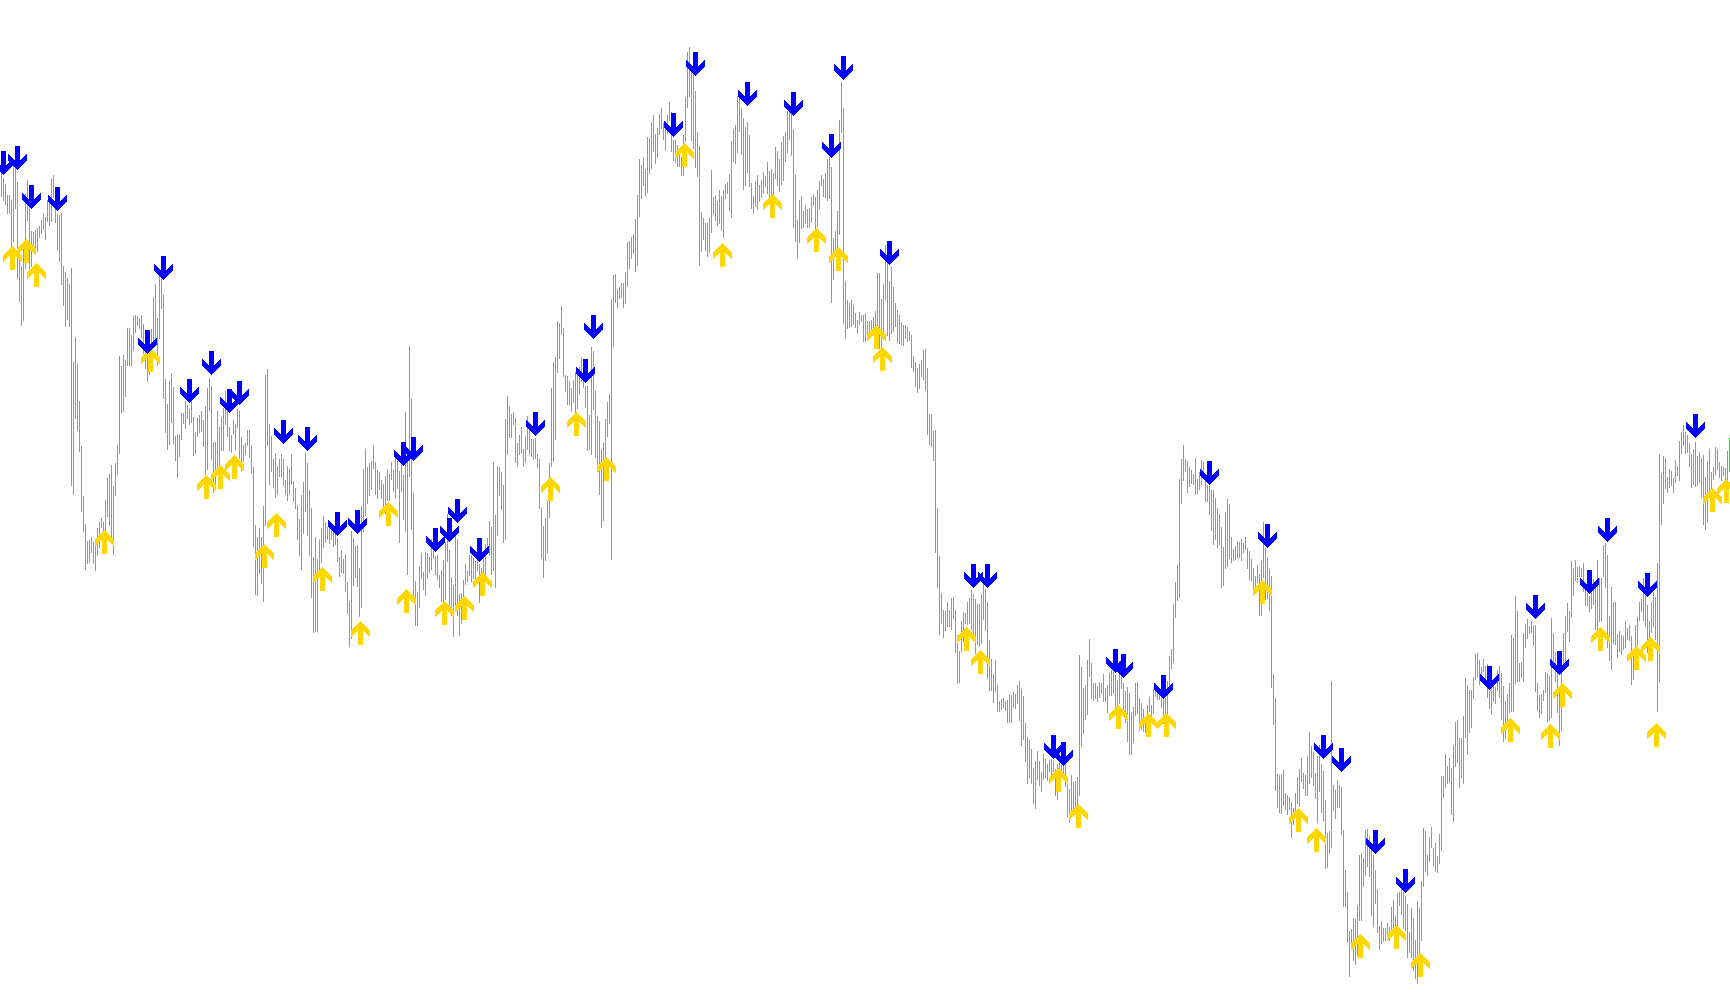
This tool is designed to help traders identify specific "crossover" moments between two different Exponential Moving Averages (EMAs) on a trading chart. While many traders already use moving averages to gauge trends, this script provides a visual and audible alert system to highlight the exact moment one average overtakes the other, which often signifies a potential shift in market momentum.
Core Logic and Functionality
1. Moving Average Interaction The script tracks two distinct moving averages: a "Faster" EMA (which reacts more quickly to recent price changes) and a "Slower" EMA (which represents a broader, longer-term trend). The primary goal of the logic is to detect the precise point where these two lines intersect.
2. Signal Identification Instead of just showing you the lines, the script actively monitors the relationship between these averages across every price bar:
- Bullish Signals (Upward Trend): When the Faster EMA moves from below the Slower EMA to above it, the script identifies a "Cross Up."
- Bearish Signals (Downward Trend): When the Faster EMA moves from above the Slower EMA to below it, the script identifies a "Cross Down."
3. Visual and Auditory Alerts To ensure these signals aren't missed—especially during fast-moving markets or when zoomed out on a chart—the tool provides two layers of notification:
- On-Chart Markers: The script places specific visual arrows (SeaGreen for upward moves and Red for downward moves) at the exact price point where the crossover occurred. This makes it easy to see historical signals at a glance.
- Real-Time Alerts: If enabled in the settings, the tool will trigger an audible alert and a popup notification on your screen the moment a new crossover is detected on the current live candle.
4. Intelligent Placement The script calculates the average range of the price action (the distance between highs and lows) to ensure that the visual arrows are placed at a clean, consistent distance away from the candles. This prevents the markers from overlapping with the price bars, keeping your chart clear and easy to read.
Summary for the User
Essentially, this script acts as a "scout." It continuously watches the interaction between two trend lines for you, automatically marking every time the market sentiment shifts from bullish to bearish (or vice versa) and notifying you instantly so you can react to the new trend in real-time.
//+------------------------------------------------------------------+
//|                                         EMA-Crossover_Signal.mq4 |
//|         Copyright © 2005, Jason Robinson (jnrtrading)            |
//|                   http://www.jnrtading.co.uk                     |
//+------------------------------------------------------------------+

/*
  +------------------------------------------------------------------+
  | Allows you to enter two ema periods and it will then show you at |
  | Which point they crossed over. It is more usful on the shorter   |
  | periods that get obscured by the bars / candlesticks and when    |
  | the zoom level is out. Also allows you then to remove the emas   |
  | from the chart. (emas are initially set at 5 and 6)              |
  +------------------------------------------------------------------+
*/
#property copyright "Copyright © 2005, Jason Robinson (jnrtrading)"
#property link      "http://www.jnrtrading.co.uk"

#property indicator_chart_window
#property indicator_buffers 2
#property indicator_color1 SeaGreen
#property indicator_color2 Red

double CrossUp[];
double CrossDown[];
extern int FasterEMA = 4;
extern int SlowerEMA = 8;
extern bool SoundON=true;
double alertTag;
 double control=2147483647;

//+------------------------------------------------------------------+
//| Custom indicator initialization function                         |
//+------------------------------------------------------------------+
int init()
  {
//---- indicators
   SetIndexStyle(0, DRAW_ARROW, EMPTY,3);
   SetIndexArrow(0, 233);
   SetIndexBuffer(0, CrossUp);
   SetIndexStyle(1, DRAW_ARROW, EMPTY,3);
   SetIndexArrow(1, 234);
   SetIndexBuffer(1, CrossDown);
//----
   return(0);
  }
//+------------------------------------------------------------------+
//| Custom indicator deinitialization function                       |
//+------------------------------------------------------------------+
int deinit()
  {
//----

//----
   return(0);
  }
//+------------------------------------------------------------------+
//| Custom indicator iteration function                              |
//+------------------------------------------------------------------+
int start() {
   int limit, i, counter;
   double fasterEMAnow, slowerEMAnow, fasterEMAprevious, slowerEMAprevious, fasterEMAafter, slowerEMAafter;
   double Range, AvgRange;
   int counted_bars=IndicatorCounted();
//---- check for possible errors
   if(counted_bars<0) return(-1);
//---- last counted bar will be recounted
   if(counted_bars>0) counted_bars--;

   limit=Bars-counted_bars;

   for(i = 0; i <= limit; i++) {

      counter=i;
      Range=0;
      AvgRange=0;
      for (counter=i ;counter<=i+9;counter++)
      {
         AvgRange=AvgRange+MathAbs(High[counter]-Low[counter]);
      }
      Range=AvgRange/10;

      fasterEMAnow = iMA(NULL, 0, FasterEMA, 0, MODE_EMA, PRICE_CLOSE, i);
      fasterEMAprevious = iMA(NULL, 0, FasterEMA, 0, MODE_EMA, PRICE_CLOSE, i+1);
      fasterEMAafter = iMA(NULL, 0, FasterEMA, 0, MODE_EMA, PRICE_CLOSE, i-1);

      slowerEMAnow = iMA(NULL, 0, SlowerEMA, 0, MODE_EMA, PRICE_CLOSE, i);
      slowerEMAprevious = iMA(NULL, 0, SlowerEMA, 0, MODE_EMA, PRICE_CLOSE, i+1);
      slowerEMAafter = iMA(NULL, 0, SlowerEMA, 0, MODE_EMA, PRICE_CLOSE, i-1);

      if ((fasterEMAnow > slowerEMAnow) && (fasterEMAprevious < slowerEMAprevious) && (fasterEMAafter > slowerEMAafter)) {
         CrossUp[i] = Low[i] - Range*0.5;
      }
      else if ((fasterEMAnow < slowerEMAnow) && (fasterEMAprevious > slowerEMAprevious) && (fasterEMAafter < slowerEMAafter)) {
          CrossDown[i] = High[i] + Range*0.5;
      }
        if (SoundON==true && i==1 && CrossUp[i] > CrossDown[i] && alertTag!=Time[0]){
         Alert("EMA Cross Trend going Down on ",Symbol()," ",Period());
        alertTag = Time[0];
      }
        if (SoundON==true && i==1 && CrossUp[i] < CrossDown[i] && alertTag!=Time[0]){
       Alert("EMA Cross Trend going Up on ",Symbol()," ",Period());
        alertTag = Time[0];
        }
  }
   return(0);
}
Comments