Elliott Wave Oscillator34_v1
Download script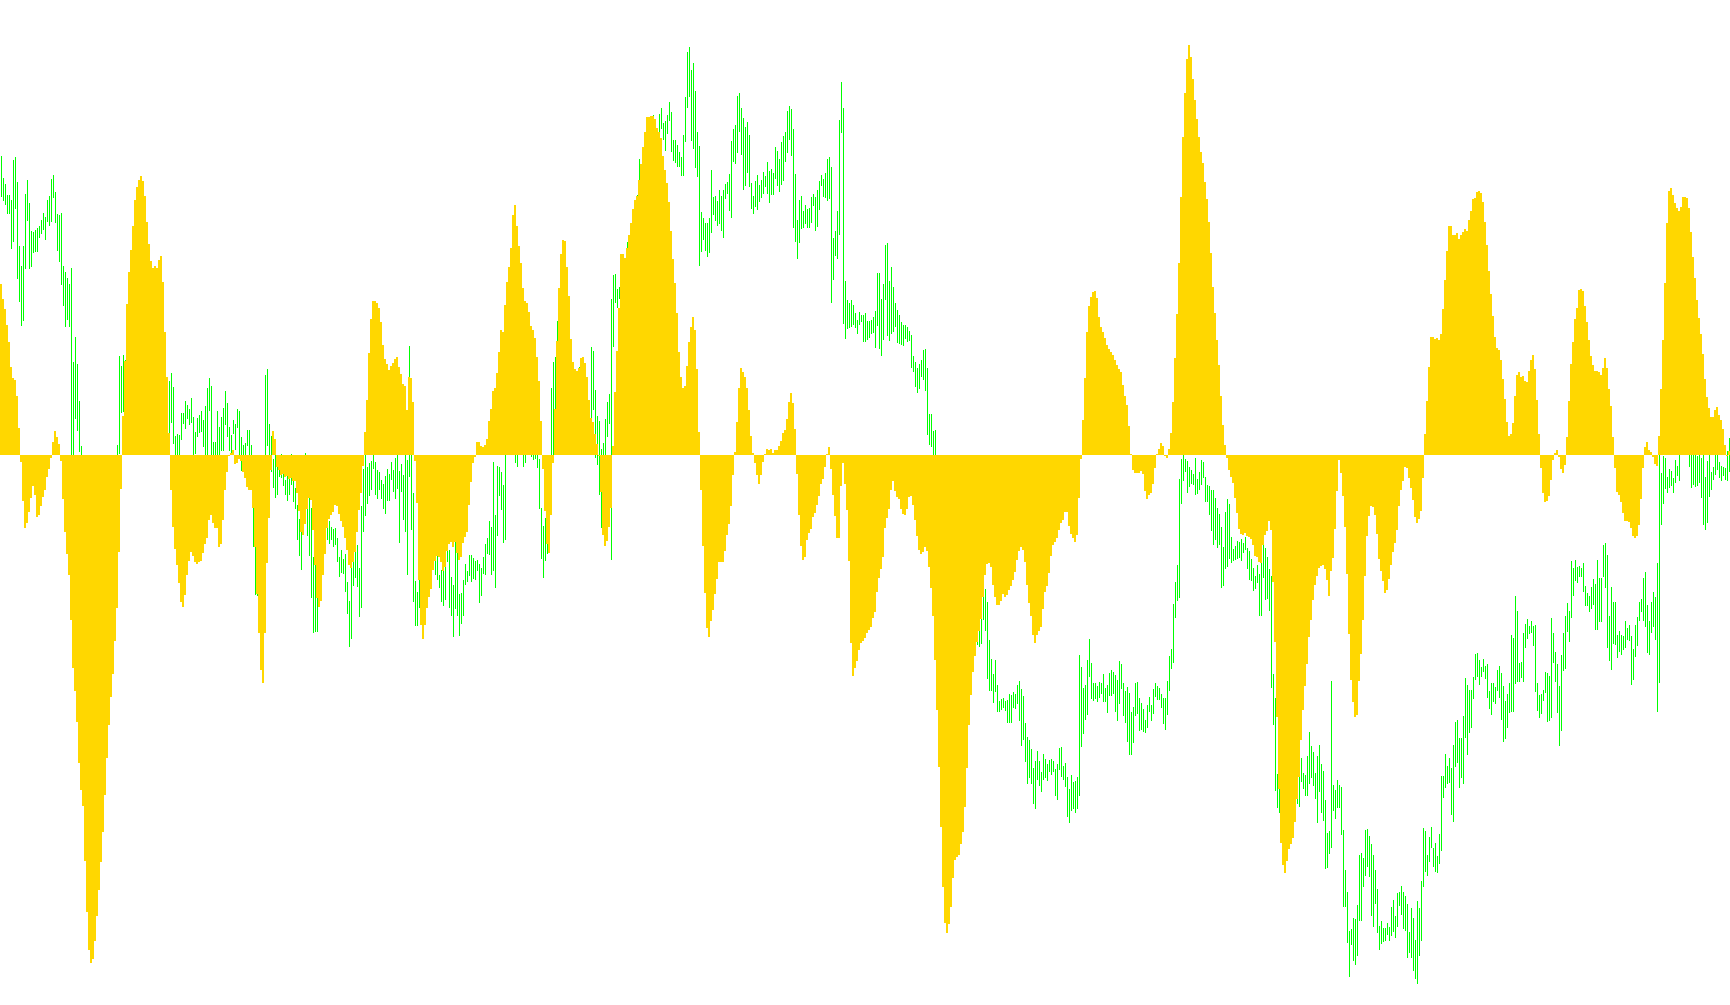
This tool is designed to provide traders with a visual representation of market momentum by analyzing the relationship between two different price averages. Instead of looking at the raw price movement, it focuses on the "gap" or "distance" between short-term trends and long-term trends to help identify potential shifts in market behavior.
Core Logic Overview
The script operates on a simple but effective mathematical principle: Difference Analysis. It evaluates the current market environment by comparing two specific types of Moving Averages (MA):
- The Short-Term Trend: The tool tracks a very fast-moving average (based on 5 periods). This represents the immediate "heartbeat" of the market.
- The Long-Term Trend: The tool tracks a much slower-moving average (based on 34 periods). This represents the broader, underlying direction of the price.
How it Works
For every point on the chart, the script performs the following calculation: It takes the value of the short-term average and subtracts the value of the long-term average from it.
The resulting figure is plotted as a Histogram. Because this is a difference between two numbers, the visual output tells you several things at a glance:
- Trend Strength: When the histogram bars are tall (either upward or downward), it indicates that the short-term price is moving significantly faster than the long-term average, suggesting a strong current trend.
- Trend Exhaustion: When the bars shrink toward the zero line, it suggests that the immediate momentum is fading and the price is returning closer to its long-term average.
- Directional Bias: Positive values (bars above the zero line) indicate that the short-term momentum is currently leading the long-term trend, while negative values (bars below the zero line) suggest the short-term momentum is lagging or moving in the opposite direction of the broader trend.
Visual Representation
By viewing this as a separate histogram window rather than on the main price chart, it allows traders to "filter out" the noise of price fluctuations and focus solely on the expanding or contracting energy of the market movement. This makes it easier to spot potential turning points where momentum might be losing steam.
/*-----------------------------+
|			       |
| Shared by www.Aptrafx.com    |
|			       |
+------------------------------*/

//+------------------------------------------------------------------+
//|                                      Elliott Wave Oscillator.mq4 |
//|                                                tonyc2a@yahoo.com |
//|                                                                  |
//+------------------------------------------------------------------+
#property copyright "tonyc2a@yahoo.com"
#property link      ""

#property indicator_separate_window
#property indicator_color1 DarkKhaki

//---- buffers
double Buffer1[];

//+------------------------------------------------------------------+
//| Custom indicator initialization function                         |
//+------------------------------------------------------------------+
int init()
  {
//---- indicators
   SetIndexStyle(0,DRAW_HISTOGRAM,STYLE_SOLID,2);
   SetIndexBuffer(0,Buffer1);
   SetIndexLabel(0,"EWO");
//----
   return(0);
  }
//+------------------------------------------------------------------+
//| Custor indicator deinitialization function                       |
//+------------------------------------------------------------------+
int deinit()
  {
//---- TODO: add your code here

//----
   return(0);
  }
//+------------------------------------------------------------------+
//| Custom indicator iteration function                              |
//+------------------------------------------------------------------+
int start()
  {
   int    counted_bars=IndicatorCounted();
   double MA5,MA34;
//---- TODO: add your code here
   for(int i=Bars;i>=0;i--){
      MA5=iMA(NULL,0,5,0,MODE_SMA,PRICE_MEDIAN,i);
      MA34=iMA(NULL,0,34,0,MODE_SMA,PRICE_MEDIAN,i);

      Buffer1[i]=MA5-MA34;
      }
//----
   return(0);
  }
//+------------------------------------------------------------------+
Comments