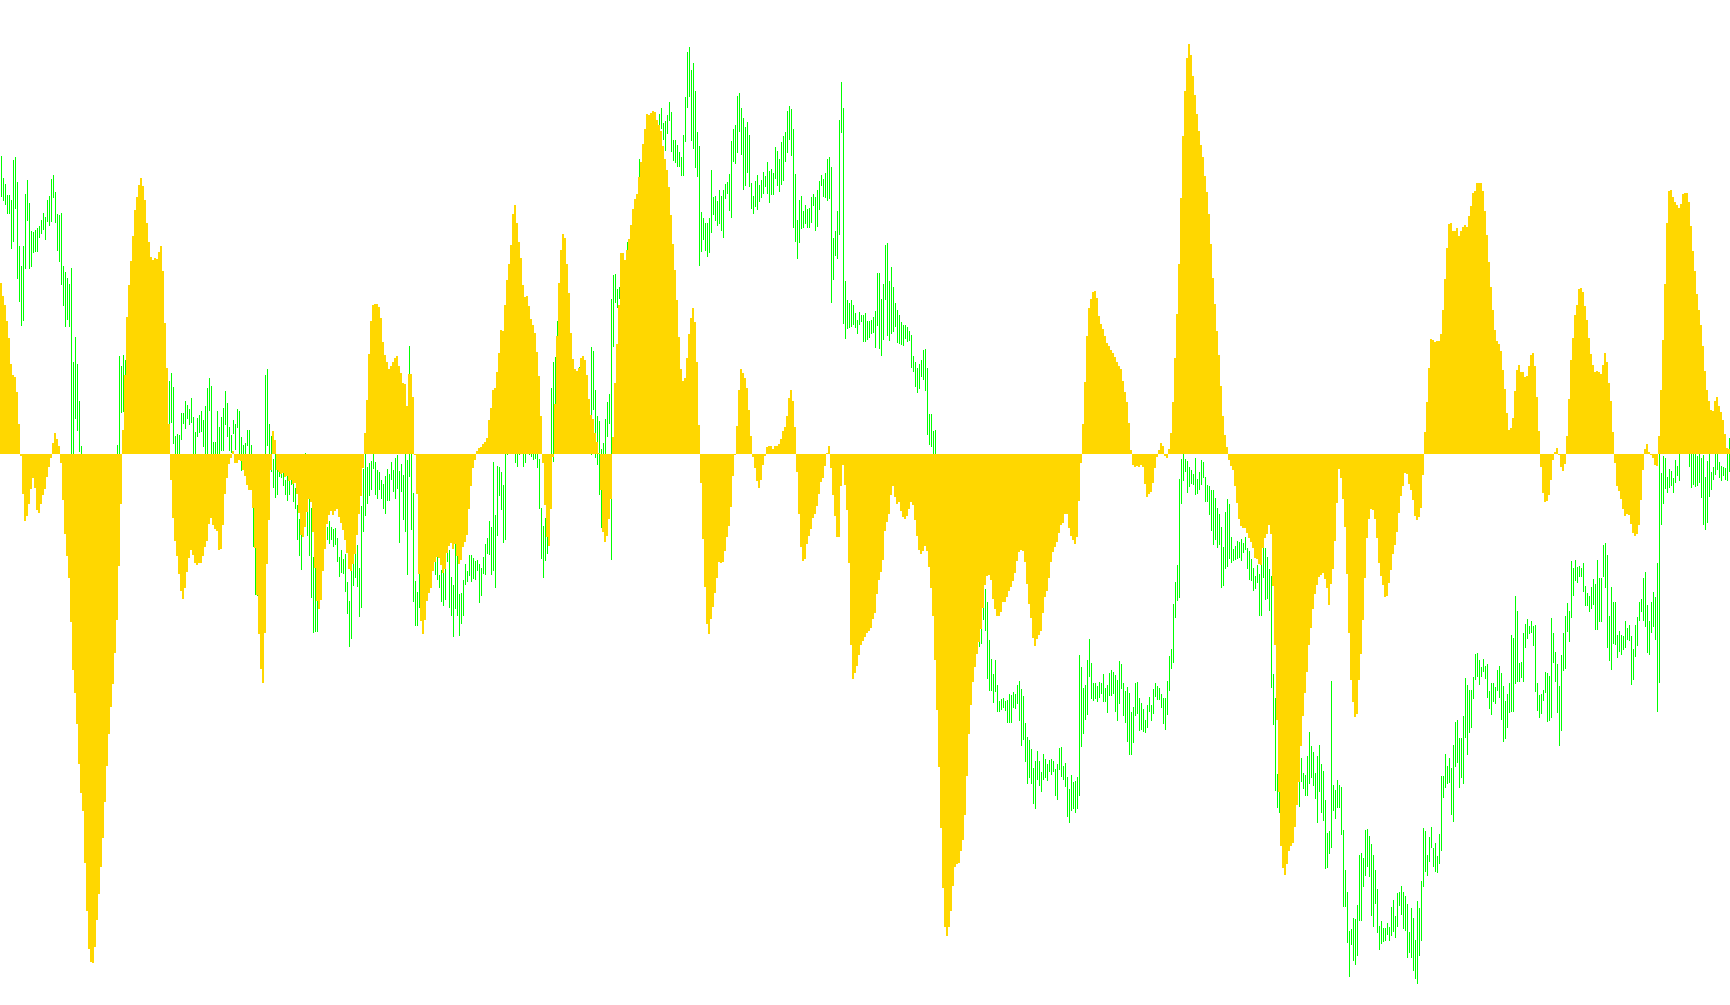
This tool is designed to help traders visualize market momentum and price trends by identifying the "gap" between short-term and long-term price movements. It operates as a visual oscillator, appearing in a separate window below your main trading chart.
How the Logic Works
The script functions by analyzing two different types of moving averages simultaneously to determine the strength of current market activity:
- Short-Term Trend (Fast): The tool calculates a moving average based on the last 5 periods. This represents the immediate, "fast" behavior of the price.
- Long-Term Trend (Slow): The tool also calculates a moving average based on the last 35 periods. This represents the broader, "slow" underlying trend of the market.
Data Visualization
Instead of showing you these two lines separately, the script performs a mathematical subtraction: it takes the value of the Fast Trend and subtracts the Slow Trend.
The resulting value is plotted as a histogram (a series of vertical bars). Here is how to interpret that visual output:
- Positive Momentum: When the bars move above the zero line, it indicates that the short-term price is moving higher than the long-term average, suggesting upward momentum.
- Negative Momentum: When the bars move below the zero line, it indicates that the short-term price is falling behind the long-term average, suggesting downward momentum.
- Convergence and Divergence: The height of the bars tells you the intensity of this momentum. Large spikes represent significant shifts in sentiment, while shrinking bars may indicate that the market is stabilizing or losing steam.
By using this logic, the oscillator helps traders identify where a trend is gaining strength or beginning to exhaust itself, providing a clearer picture of market dynamics beyond just looking at the price alone.
/*-----------------------------+
|			       |
| Shared by www.Aptrafx.com    |
|			       |
+------------------------------*/

//+------------------------------------------------------------------+
//|                                      Elliott Wave Oscillator.mq4 |
//|                                                tonyc2a@yahoo.com |
//|                                                                  |
//+------------------------------------------------------------------+
#property copyright "tonyc2a@yahoo.com"
#property link      ""

#property indicator_separate_window
#property indicator_color1 DarkKhaki

//---- buffers
double Buffer1[];

//+------------------------------------------------------------------+
//| Custom indicator initialization function                         |
//+------------------------------------------------------------------+
int init()
  {
//---- indicators
   SetIndexStyle(0,DRAW_HISTOGRAM,STYLE_SOLID,2);
   SetIndexBuffer(0,Buffer1);
   SetIndexLabel(0,"EWO");
//----
   return(0);
  }
//+------------------------------------------------------------------+
//| Custor indicator deinitialization function                       |
//+------------------------------------------------------------------+
int deinit()
  {
//---- TODO: add your code here

//----
   return(0);
  }
//+------------------------------------------------------------------+
//| Custom indicator iteration function                              |
//+------------------------------------------------------------------+
int start()
  {
   int    counted_bars=IndicatorCounted();
   double MA5,MA35;
//---- TODO: add your code here
   for(int i=Bars;i>=0;i--){
      MA5=iMA(NULL,0,5,0,MODE_SMA,PRICE_MEDIAN,i);
      MA35=iMA(NULL,0,35,0,MODE_SMA,PRICE_MEDIAN,i);

      Buffer1[i]=MA5-MA35;
      }
//----
   return(0);
  }
//+------------------------------------------------------------------+
Comments