Elliott Wave Oscillator34
Download script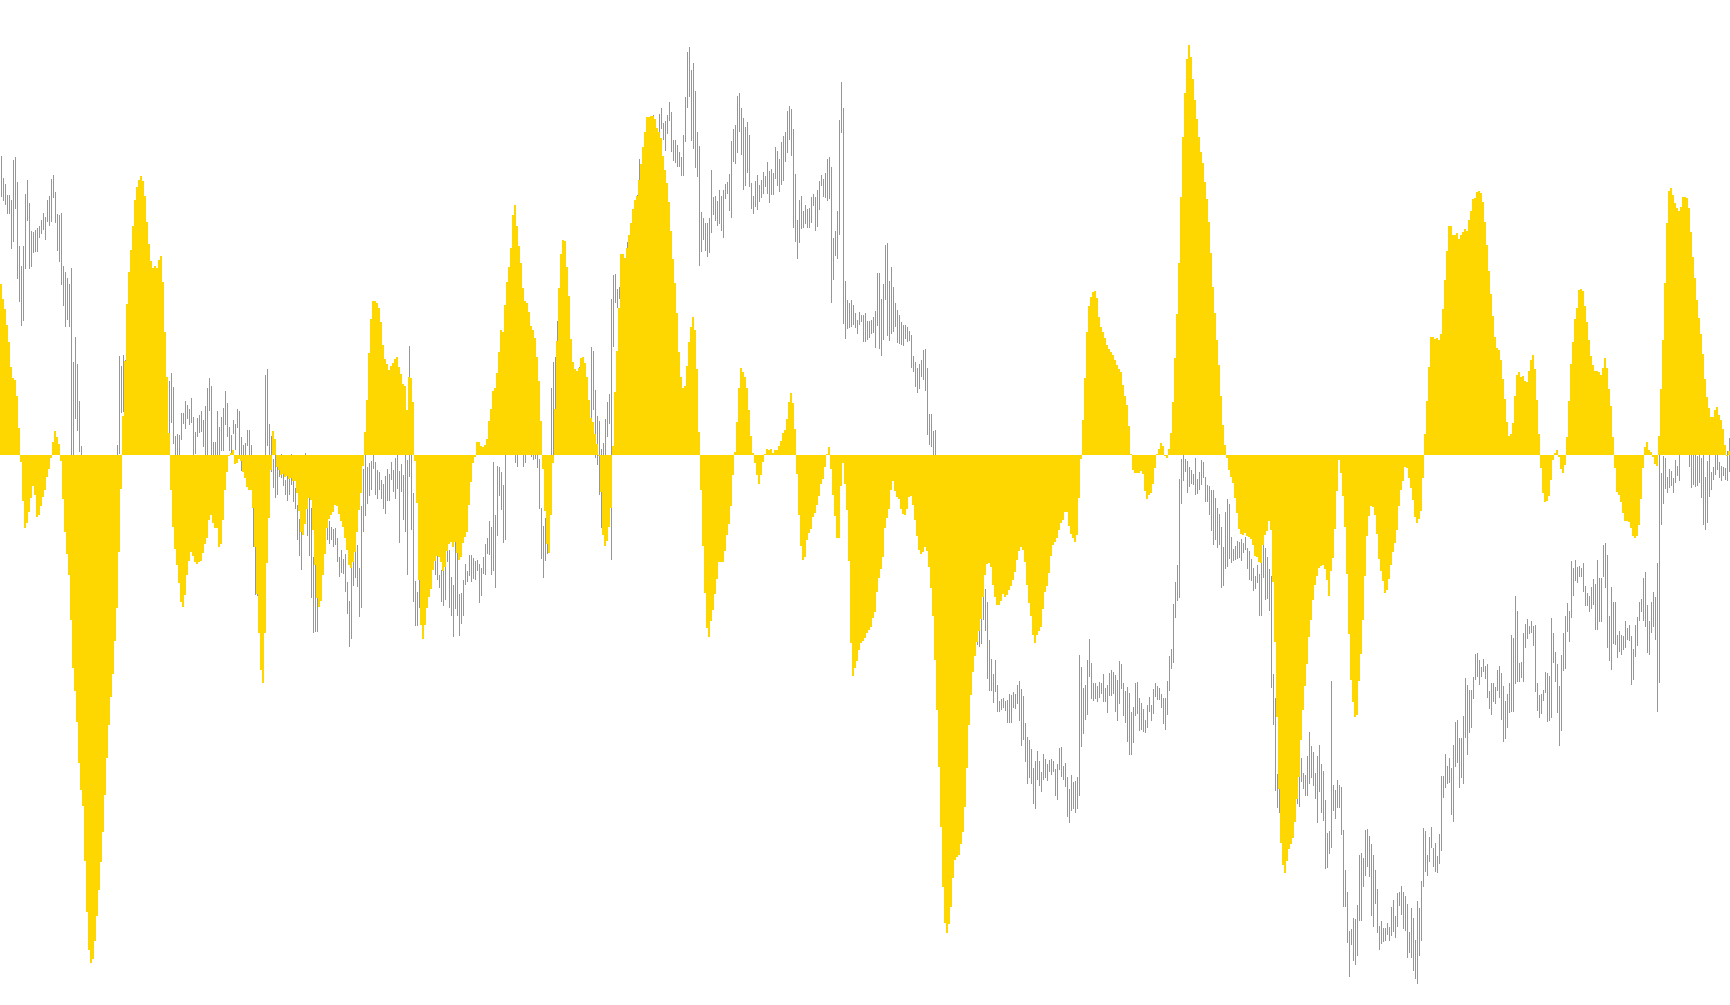
The Elliott Wave Oscillator is a visual tool designed to help traders identify momentum shifts and trends by measuring the distance between two different types of moving averages. Instead of looking at the raw price action, this tool smooths out market "noise" to highlight the underlying strength of a price move.
How the Logic Works
The script functions by calculating two distinct mathematical averages based on recent price data:
- Short-Term Average: This tracks very recent price movements (a 5-period simple moving average). It reacts quickly to sudden changes in market direction.
- Long-Term Average: This tracks a broader trend over a longer period (a 34-period simple moving average). This represents the more stable, "big picture" direction of the market.
The core logic of the oscillator is to find the difference between these two averages at every point in time. By subtracting the long-term average from the short-term average, the script produces a specific numerical value that determines the height of the bars on your chart.
How to Interpret the Results
Because the tool measures the "gap" between fast and slow trends, it provides several visual cues for traders:
- Positive Momentum: When the bars move above the zero line, it indicates that the short-term price is moving faster or higher than the long-term trend. This suggests bullish strength.
- Negative Momentum: When the bars drop below the zero line, it signifies that the short-term price is pulling back or falling lower than the long-term trend, suggesting bearish pressure.
- Trend Strength: The height of the bars indicates the intensity of the momentum. Taller bars suggest a widening gap between current price action and the historical average (stronger momentum), while shorter bars suggest the market is stabilizing or consolidating.
Essentially, this tool acts as a "speedometer" for the market, allowing you to see not just which direction the price is moving, but how much force is being behind that movement.
//+------------------------------------------------------------------+
//|                                      Elliott Wave Oscillator.mq4 |
//|                                                tonyc2a@yahoo.com |
//|                                                                  |
//+------------------------------------------------------------------+
#property copyright "tonyc2a@yahoo.com"
#property link      ""

#property indicator_separate_window
#property indicator_color1 DarkKhaki

//---- buffers
double Buffer1[];

//+------------------------------------------------------------------+
//| Custom indicator initialization function                         |
//+------------------------------------------------------------------+
int init()
  {
//---- indicators
   SetIndexStyle(0,DRAW_HISTOGRAM,STYLE_SOLID,2);
   SetIndexBuffer(0,Buffer1);
   SetIndexLabel(0,"EWO");
//----
   return(0);
  }
//+------------------------------------------------------------------+
//| Custor indicator deinitialization function                       |
//+------------------------------------------------------------------+
int deinit()
  {
//---- TODO: add your code here

//----
   return(0);
  }
//+------------------------------------------------------------------+
//| Custom indicator iteration function                              |
//+------------------------------------------------------------------+
int start()
  {
   int    counted_bars=IndicatorCounted();
   double MA5,MA34;
//---- TODO: add your code here
   for(int i=Bars;i>=0;i--){
      MA5=iMA(NULL,0,5,0,MODE_SMA,PRICE_MEDIAN,i);
      MA34=iMA(NULL,0,34,0,MODE_SMA,PRICE_MEDIAN,i);

      Buffer1[i]=MA5-MA34;
      }
//----
   return(0);
  }
//+------------------------------------------------------------------+
Comments