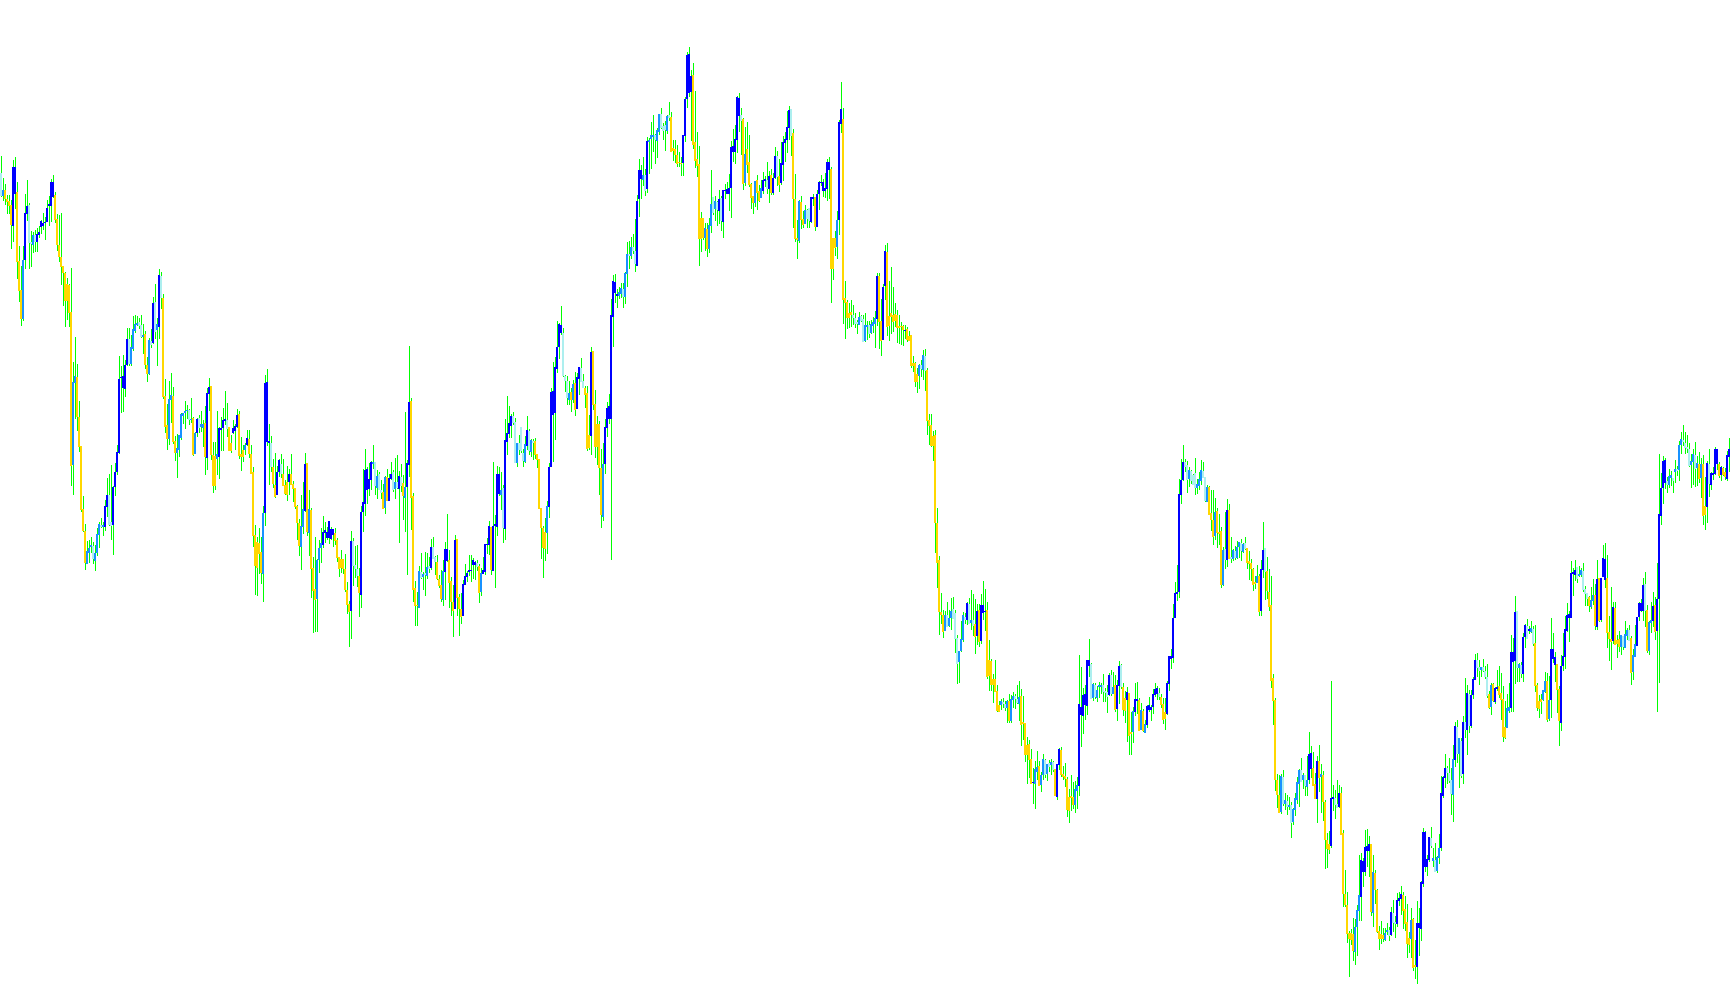
This script is a custom technical indicator designed for the MetaTrader 4 platform. It functions by blending two distinct types of market analysis—trend direction and momentum—to visually simplify price action on your trading chart. Instead of showing standard candles, it uses this logic to color-code the market's current "mood."
Core Logic Overview
The indicator works by looking at two primary mathematical components simultaneously:
- Trend Identification (EMA): It calculates an Exponential Moving Average (EMA). By comparing the current EMA value against its previous value, the script determines if the overarching trend is moving upward or downward.
- Momentum Strength (MACD): It utilizes the MACD (Moving Average Convergence Divergence) indicator to measure the speed and strength of price movements. The script calculates whether this momentum is accelerating in a positive or negative direction.
How the Visuals are Decided
The tool combines these two signals to categorize every price bar into one of three distinct visual states:
- Bullish Sentiment (Lime Color): This occurs when both the trend (EMA) and the momentum (MACD) are moving upward. The script identifies this as a strong "up" move and highlights the price action accordingly.
- Bearish Sentiment (Red Color): This occurs when both the trend and the momentum are moving downward. The script identifies this as a strong "down" move and highlights it to alert the user of a prevailing sell sentiment.
- Neutral/Transitionary Sentiment (Blue Color): If the trend and momentum are不一致 (conflicting)—for example, if the trend is up but the momentum is slowing down, or vice versa—the script classifies the market as neutral. This is visually represented in blue, signaling a period of indecision or a potential turning point.
Key Features
- Dynamic Calculations: The script can be configured to use the standard MT4 MACD calculation or a customized internal version, providing flexibility for different trading styles.
- Customizable Timeframes: It allows users to set specific periods for the Moving Averages and MACD signals, enabling you to tune the sensitivity of the indicator to match your specific trading strategy (e.g., scalping vs. long-term swing trading).
- Simplified Visuals: By transforming complex data into a colored histogram-style display, it helps traders filter out "market noise" and focus on the primary direction of the price flow.
Indicators Used
Miscellaneous
10
Views
0
Downloads
0
Favorites
Elder Impulse Candle Color1
//+------------------------------------------------------------------+
//|                                                  Heiken Ashi.mq4 |
//|                      Copyright c 2004, MetaQuotes Software Corp. |
//|                                        http://www.metaquotes.net |
//+------------------------------------------------------------------+
#property copyright "Copyright © 2004, MetaQuotes Software Corp."
#property link      "http://www.metaquotes.net"

#property indicator_chart_window
#property indicator_buffers 4
#property indicator_color1 Red
#property indicator_color2 Lime
#property indicator_color3 Blue
#property indicator_color4 Blue
#property indicator_width1 3
#property indicator_width2 3
#property indicator_width3 3
#property indicator_width4 3

extern int       TimeFrame=0;
extern int       EMA_Period=13;
extern int       MACD_FastPeriod=12;
extern int       MACD_SlowPeriod=26;
extern int       MACD_SignalPeriod=9;
extern bool      UseMT4MACD=false;

//---- buffers
double ExtMapBuffer1[];
double ExtMapBuffer2[];
double ExtMapBuffer3[];
double ExtMapBuffer4[];

double MACDLineBuffer[];
double MACDSignalLineBuffer[];
double MACDHistogramBuffer[];

//----
int ExtCountedBars=0;
//+------------------------------------------------------------------+
//| Custom indicator initialization function                         |
//|------------------------------------------------------------------|
int init()
  {
   IndicatorBuffers(7);

//---- indicators
   SetIndexStyle(0,DRAW_HISTOGRAM, 0, 3);
   SetIndexBuffer(0, ExtMapBuffer1);
   SetIndexStyle(1,DRAW_HISTOGRAM, 0, 3);
   SetIndexBuffer(1, ExtMapBuffer2);
   SetIndexStyle(2,DRAW_HISTOGRAM, 0, 3);
   SetIndexBuffer(2, ExtMapBuffer3);
   SetIndexStyle(3,DRAW_HISTOGRAM, 0, 3);
   SetIndexBuffer(3, ExtMapBuffer4);
//----
   SetIndexDrawBegin(0,MACD_SlowPeriod);
   SetIndexDrawBegin(1,MACD_SlowPeriod);
   SetIndexDrawBegin(2,MACD_SlowPeriod);
   SetIndexDrawBegin(3,MACD_SlowPeriod);

//---- indicator buffers mapping
   SetIndexBuffer(0,ExtMapBuffer1);
   SetIndexBuffer(1,ExtMapBuffer2);
   SetIndexBuffer(2,ExtMapBuffer3);
   SetIndexBuffer(3,ExtMapBuffer4);

   SetIndexEmptyValue(4,0.0);
   SetIndexBuffer(4,MACDSignalLineBuffer);
   SetIndexEmptyValue(5,0.0);
   SetIndexBuffer(5,MACDLineBuffer);
   SetIndexEmptyValue(6,0.0);
   SetIndexBuffer(6,MACDHistogramBuffer);
//---- initialization done

   return(0);
  }
//+------------------------------------------------------------------+
//| Custom indicator deinitialization function                       |
//+------------------------------------------------------------------+
int deinit()
  {
//---- TODO: add your code here

//----
   return(0);
  }
//+------------------------------------------------------------------+
//| Custom indicator iteration function                              |
//+------------------------------------------------------------------+
int start()
  {
   int    limit,y=0,counted_bars=IndicatorCounted();
   double ema1, main1, signal1, ema0, main0, signal0, macd1, macd0, main;
   double alpha = 2.0 / (MACD_SignalPeriod + 1.0);
   double alpha_1 = 1.0 - alpha;
   double BarValue, aOpen, aClose;

   if(Bars<=10) return(0);
   ExtCountedBars=IndicatorCounted();
//---- check for possible errors
   if (ExtCountedBars<0) return(-1);
//---- last counted bar will be recounted
   if (ExtCountedBars>0) ExtCountedBars--;
   int pos=Bars-ExtCountedBars-1;
   while(pos>=0)
   {
      y = iBarShift(NULL,TimeFrame,Time[pos]);
      ema0=iMA(NULL,TimeFrame,EMA_Period,0,MODE_EMA,PRICE_CLOSE,y);
      ema1=iMA(NULL,TimeFrame,EMA_Period,0,MODE_EMA,PRICE_CLOSE,y+1);

      if(UseMT4MACD)
      {
        main0=iMACD(NULL, TimeFrame, MACD_FastPeriod, MACD_SlowPeriod, MACD_SignalPeriod, PRICE_CLOSE,0,y);
        main1=iMACD(NULL, TimeFrame, MACD_FastPeriod, MACD_SlowPeriod, MACD_SignalPeriod, PRICE_CLOSE,0,y+1);

        signal0=iMACD(NULL, TimeFrame, MACD_FastPeriod, MACD_SlowPeriod, MACD_SignalPeriod, PRICE_CLOSE,1,y);
        signal1=iMACD(NULL, TimeFrame, MACD_FastPeriod, MACD_SlowPeriod, MACD_SignalPeriod, PRICE_CLOSE,1,y+1);

        main=main0;
        macd0=main0-signal0;
        macd1=main1-signal1;
      } else
      {
        MACDLineBuffer[y] = iMA(NULL,TimeFrame,MACD_FastPeriod,0,MODE_EMA,PRICE_CLOSE,y)-
                            iMA(NULL,TimeFrame,MACD_SlowPeriod,0,MODE_EMA,PRICE_CLOSE,y);
        MACDSignalLineBuffer[y]=(alpha*MACDLineBuffer[y]) + (alpha_1*MACDSignalLineBuffer[y+1]);
        MACDHistogramBuffer[y]=MACDLineBuffer[y]-MACDSignalLineBuffer[y];

        main=MACDLineBuffer[y];
        macd0=MACDHistogramBuffer[y];
        macd1=MACDHistogramBuffer[y+1];
      }
      aOpen=Open[pos];
      aClose=Close[pos];
      if(ema0<ema1 && macd0<macd1) //both down - Red
      {
        if(aOpen<aClose)
        {
          ExtMapBuffer1[pos]=aClose;
          ExtMapBuffer2[pos]=aOpen;
          ExtMapBuffer3[pos]=EMPTY_VALUE;
          ExtMapBuffer4[pos]=EMPTY_VALUE;
        } else
        {
          ExtMapBuffer1[pos]=aOpen;
          ExtMapBuffer2[pos]=aClose;
          ExtMapBuffer3[pos]=EMPTY_VALUE;
          ExtMapBuffer4[pos]=EMPTY_VALUE;
        }
      } else
      if(ema0>ema1 && macd0>macd1) //both up - Lime
      {
        if(aOpen<aClose)
        {
          ExtMapBuffer1[pos]=aOpen;
          ExtMapBuffer2[pos]=aClose;
          ExtMapBuffer3[pos]=EMPTY_VALUE;
          ExtMapBuffer4[pos]=EMPTY_VALUE;
        } else
        {
          ExtMapBuffer1[pos]=aClose;
          ExtMapBuffer2[pos]=aOpen;
          ExtMapBuffer3[pos]=EMPTY_VALUE;
          ExtMapBuffer4[pos]=EMPTY_VALUE;
        }
      } else  //otherwise - Blue
      {
          ExtMapBuffer3[pos]=aOpen;
          ExtMapBuffer4[pos]=aClose;
          ExtMapBuffer1[pos]=EMPTY_VALUE;
          ExtMapBuffer2[pos]=EMPTY_VALUE;
      }
      pos--;
   }
//----
   return(0);
  }
//+------------------------------------------------------------------+
Comments