MA in Color_Hist
Download script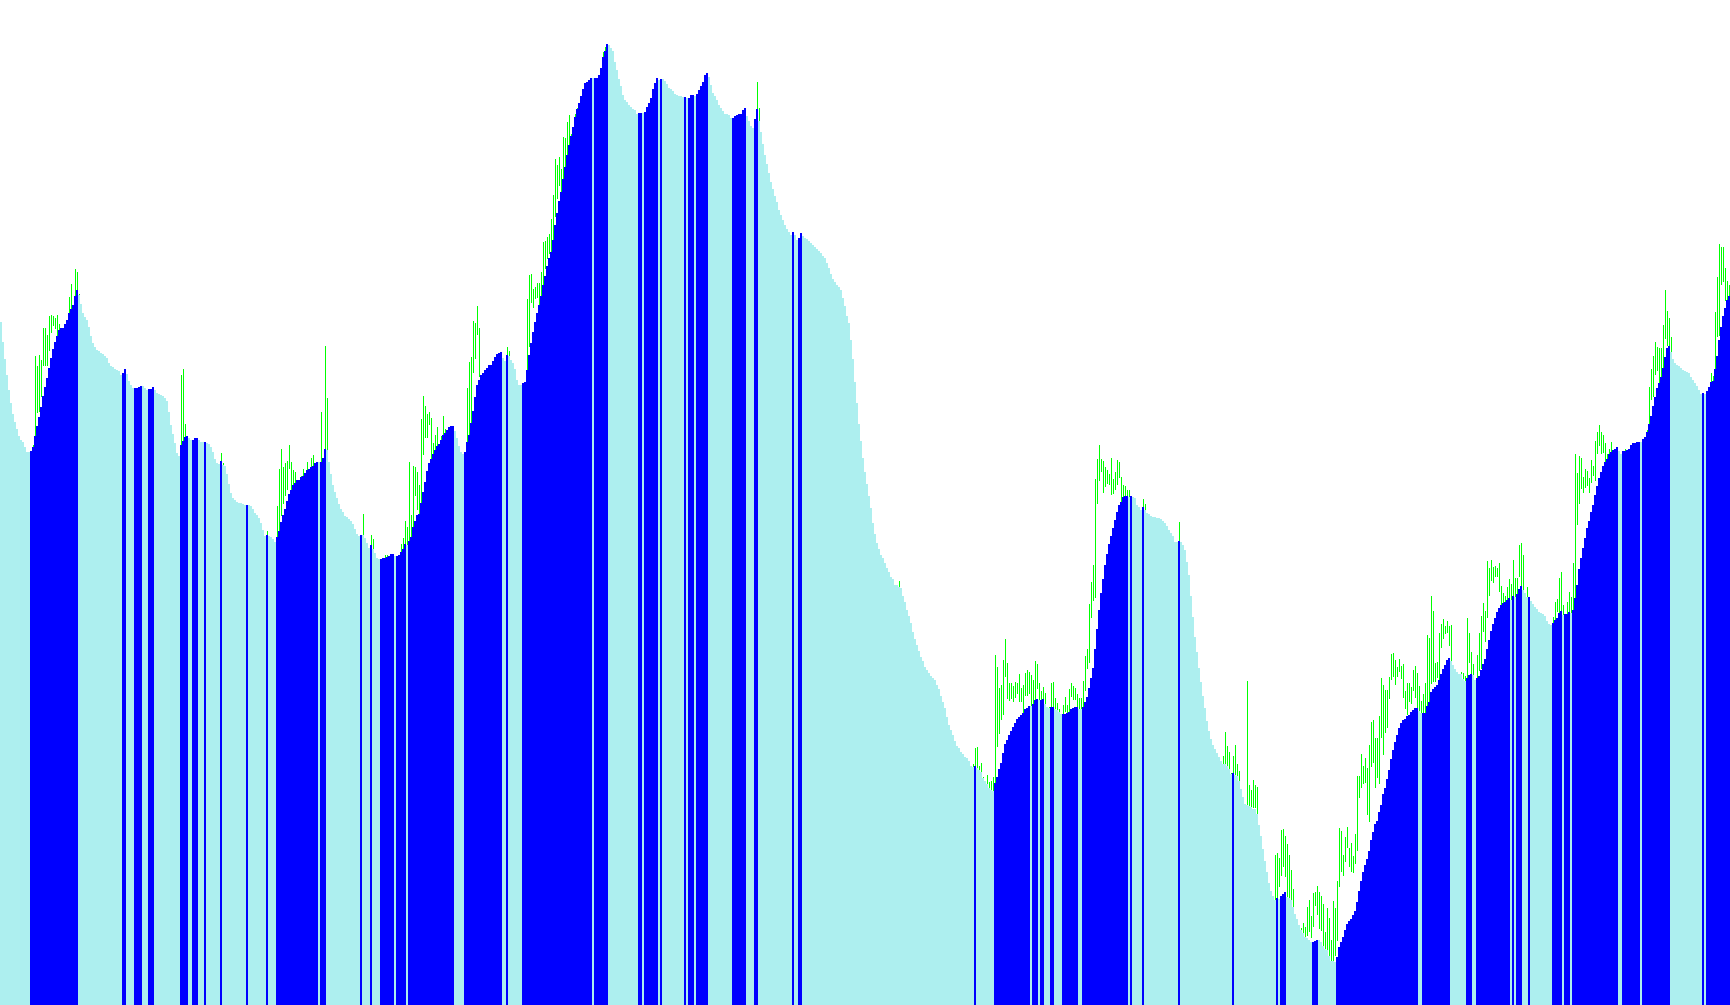
This tool is a visual trading indicator designed for the MetaTrader platform. Its primary purpose is to track price trends by calculating a Moving Average (MA) and displaying it as a dynamic, color-coded histogram in a separate window below your main price chart.
Core Functionality
The script analyzes market data to determine the general direction of price movement. Rather than just showing a static line, it uses three distinct colors—Yellow, Green, and Red—to provide an immediate visual cue regarding whether the momentum is shifting upwards or downwards.
Key Features and Logic:
1. Flexible Moving Average Types The tool allows you to choose between several different types of Moving Averages, depending on how "smooth" or "reactive" you want the data to be. These include:
- Simple Moving Average (SMA): The standard average of prices over a specific period.
- Exponential Moving Average (EMA): Gives more weight to recent price action.
- Smooth Moving Average (SMMA) and Linear Weighted Moving Average (LWMA): Variations that prioritize different weights of data points.
- Least Squares Moving Average (LSMA): A sophisticated linear regression calculation that attempts to predict the path of the price.
2. Customizable Price Input A unique feature of this script is its ability to decide which specific price data point to use for its calculations. Instead of only looking at where a candle "closed," you can configure it to calculate based on:
- The Opening or Closing price.
- The High or Low points of a candle.
- Mathematical averages of these points (such as the Median, Typical, or Weighted prices).
3. Dynamic Color Coding The logic behind the colors is driven by comparing the current moving average value against the previous one:
- Green: Appears when the trend is moving upward (the current value is higher than the previous one).
- Yellow: Appears when the trend is moving downward (the current value is lower than the previous one).
- Red: Serves as a secondary visual buffer within the logic to help define the boundaries of these movements.
How to Read the Visuals
Because the indicator uses "buffers," it effectively switches colors on the fly. When the price momentum trends up, the histogram will highlight in green; when the trend shifts down, it will switch to yellow. This allows a trader to see at a glance whether the current market sentiment is bullish or bearish without having to manually calculate the differences between historical data points.
//+------------------------------------------------------------------+
//|                                  MA_In_Color_wAppliedPrice.mq4   |
//|                      Copyright © 2004, MetaQuotes Software Corp. |
//| Modified from LSMA_In_Color to use any MA by Robert Hill         |
//| Added use of Applied Price by Robert Hill/*Histogram by "OTCFX"  |
//+------------------------------------------------------------------+
#property  copyright "Copyright © 2006, FX Sniper and Robert Hill"
#property  link      "http://www.metaquotes.net/"

//---- indicator settings

#property  indicator_separate_window
#property  indicator_buffers 3
#property indicator_color1 Yellow
#property indicator_color2 Green
#property indicator_color3 Red
#property indicator_maximum 1
#property indicator_minimum  0
extern int       LineWidth=4;
extern int       MAPeriod=20;
extern int       MAType=1;
extern int       MAAppliedPrice = 0;//0=close, 1=open, 2=high, 3=low, 4=median(high+low)/2, 5=typical(high+low+close)/3, 6=weighted(high+low+close+close)/4

//---- buffers

double ExtMapBuffer1[];
double ExtMapBuffer2[];
double ExtMapBuffer3[];

//---- variables

int    MAMode;
string strMAType;


//+------------------------------------------------------------------+
//| Custom indicator initialization function                         |
//+------------------------------------------------------------------+
int init()
  {
   IndicatorBuffers(3);

//---- drawing settings
   SetIndexBuffer(2,ExtMapBuffer1);
   SetIndexBuffer(1,ExtMapBuffer2);
   SetIndexBuffer(0,ExtMapBuffer3);

   SetIndexStyle(2,DRAW_HISTOGRAM,STYLE_SOLID,LineWidth);
   SetIndexStyle(1,DRAW_HISTOGRAM,STYLE_SOLID,LineWidth);
   SetIndexStyle(0,DRAW_HISTOGRAM,STYLE_SOLID,LineWidth);
switch (MAType)
   {
      case 1: strMAType="EMA"; MAMode=MODE_EMA; break;
      case 2: strMAType="SMMA"; MAMode=MODE_SMMA; break;
      case 3: strMAType="LWMA"; MAMode=MODE_LWMA; break;
      case 4: strMAType="LSMA"; break;
      default: strMAType="SMA"; MAMode=MODE_SMA; break;
   }
   IndicatorShortName( strMAType+ " (" +MAPeriod + ") ");
//---- initialization done
   return(0);
  }

//+------------------------------------------------------------------+
//| LSMA with PriceMode                                              |
//| PrMode  0=close, 1=open, 2=high, 3=low, 4=median(high+low)/2,    |
//| 5=typical(high+low+close)/3, 6=weighted(high+low+close+close)/4  |
//+------------------------------------------------------------------+

double LSMA(int Rperiod, int prMode, int shift)
{
   int i;
   double sum, pr;
   int length;
   double lengthvar;
   double tmp;
   double wt;

   length = Rperiod;

   sum = 0;
   for(i = length; i >= 1  ; i--)
   {
     lengthvar = length + 1;
     lengthvar /= 3;
     tmp = 0;
     switch (prMode)
     {
     case 0: pr = Close[length-i+shift];break;
     case 1: pr = Open[length-i+shift];break;
     case 2: pr = High[length-i+shift];break;
     case 3: pr = Low[length-i+shift];break;
     case 4: pr = (High[length-i+shift] + Low[length-i+shift])/2;break;
     case 5: pr = (High[length-i+shift] + Low[length-i+shift] + Close[length-i+shift])/3;break;
     case 6: pr = (High[length-i+shift] + Low[length-i+shift] + Close[length-i+shift] + Close[length-i+shift])/4;break;
     }
     tmp = ( i - lengthvar)*pr;
     sum+=tmp;
    }
    wt = sum*6/(length*(length+1));

    return(wt);
}

int start()

  {

   double MA_Cur, MA_Prev;
   int limit;
   int counted_bars = IndicatorCounted();
   //---- check for possible errors
   if (counted_bars<0) return(-1);
   //---- last counted bar will be recounted
   if (counted_bars>0) counted_bars--;
   limit = Bars - counted_bars;

   for(int i=limit; i>=0; i--)
   {
      if (MAType == 4)
      {
        MA_Cur = LSMA(MAPeriod, MAAppliedPrice,i);
        MA_Prev = LSMA(MAPeriod, MAAppliedPrice,i+1);
      }
      else
      {
        MA_Cur = iMA(NULL,0,MAPeriod,0,MAMode, MAAppliedPrice,i);
        MA_Prev = iMA(NULL,0,MAPeriod,0,MAMode, MAAppliedPrice,i+1);
      }


//========== COLOR CODING ===========================================

       ExtMapBuffer3[i] = MA_Cur; //red
       ExtMapBuffer2[i] = MA_Cur; //green
       ExtMapBuffer1[i] = MA_Cur; //yellow

        if (MA_Prev > MA_Cur)
        {
        ExtMapBuffer2[i] = EMPTY_VALUE;

        }
       else if (MA_Prev < MA_Cur)
        {
        ExtMapBuffer1[i] = EMPTY_VALUE; //-1 red/greem tight

        }
         else
         {

         ExtMapBuffer1[i]=EMPTY_VALUE;//EMPTY_VALUE;
         ExtMapBuffer2[i]=EMPTY_VALUE;//EMPTY_VALUE;
         }

      }

      return(0);
  }
//+------------------------------------------------------------------+
Comments