EES-Velocity
Download script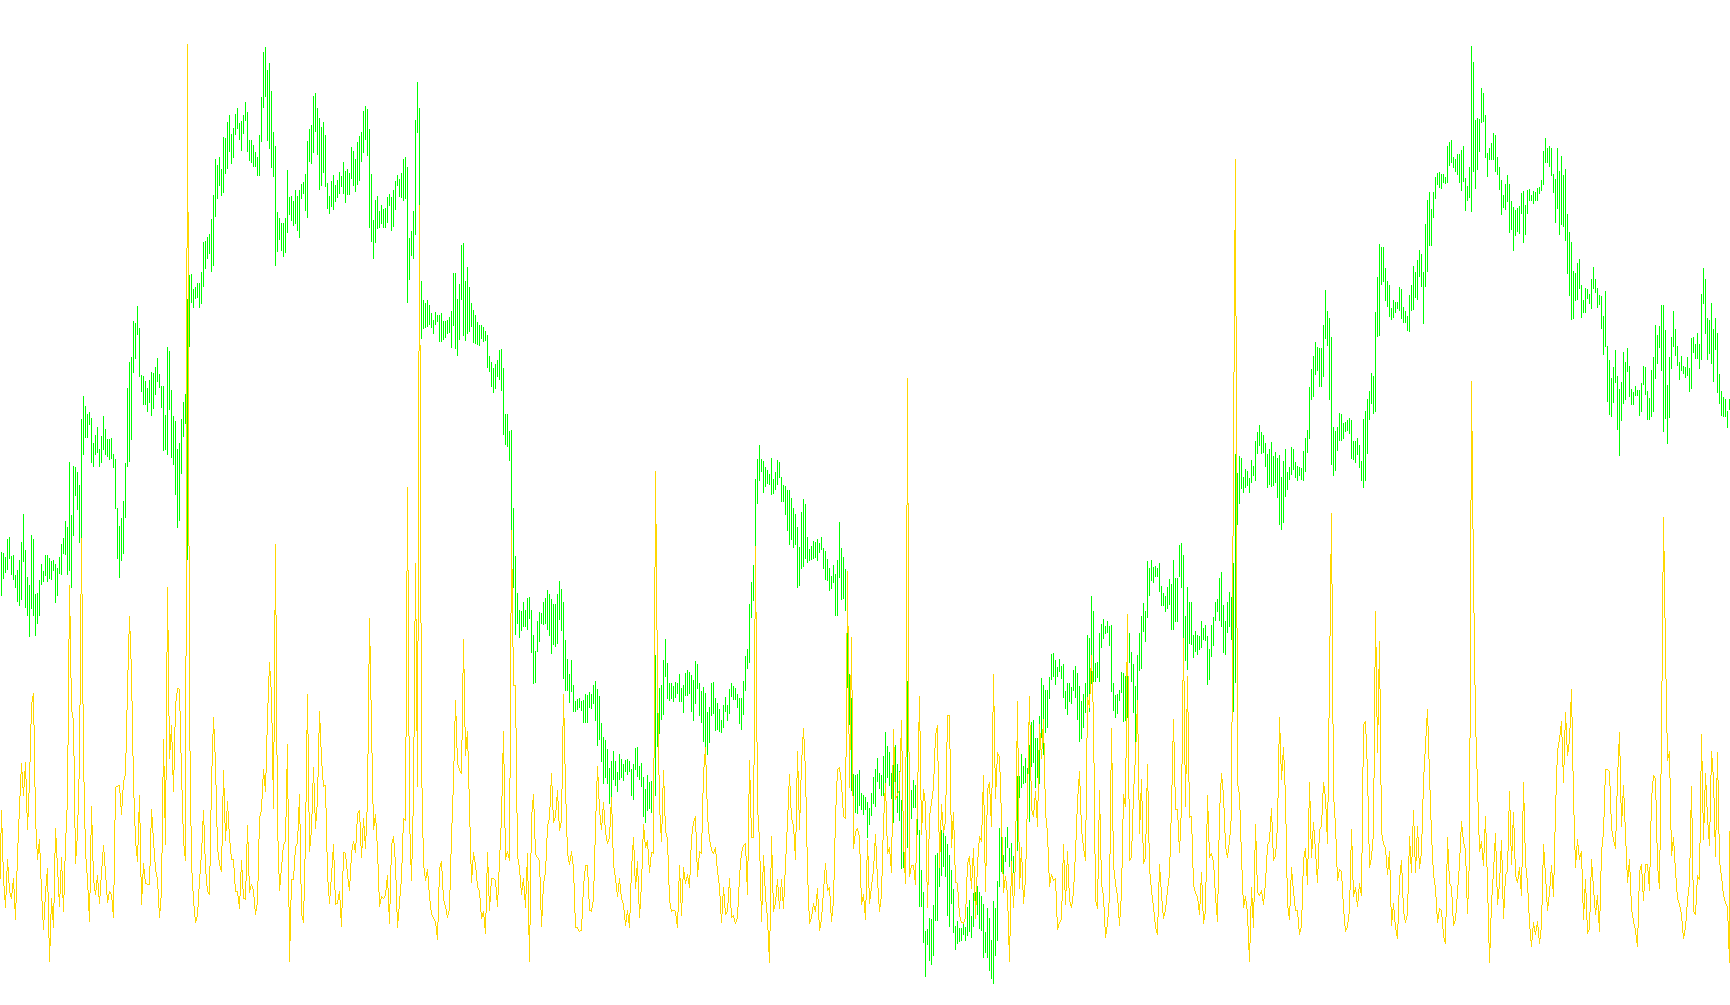
The EES-Velocity indicator is designed to provide traders with a visual representation of market activity by measuring how quickly and intensely price movements are occurring. Rather than simply looking at the direction of the price, this tool focuses on the "speed" of the market, allowing users to differentiate between steady trends and rapid, high-energy fluctuations.
The logic behind the indicator operates on two primary metrics:
1. Volatility Speed (Market Velocity)
The first component of the indicator calculates how much price movement occurs within a specific window of time. By taking the difference between the highest and lowest prices reached during a period and dividing it by the actual time elapsed, the script determines the "velocity" of the price action.
A key feature here is the Time Input setting. This allows you to choose whether you want to measure velocity based on seconds, minutes, hours, or days. Depending on your preference, the indicator will normalize these timeframes to show how fast the market is moving relative to your chosen unit of measurement.
2. Volume-Adjusted Velocity (Relative Intensity)
The second component provides a deeper layer of analysis by incorporating trading volume into the velocity equation. This calculation determines the price movement relative to the amount of trading activity occurring. By dividing the price range by the volume, the indicator helps identify the "effort" behind a move:
- It can highlight instances where significant price changes are happening on low volume (which might indicate a lack of conviction).
- Conversely, it can highlight periods where high price movement is backed by heavy volume, signaling strong market momentum.
Summary of Visual Output
The indicator produces two distinct lines on a separate sub-window:
- Volatility Line: Shows the raw speed of price changes over your selected timeframe.
- VTick Line: Shows the intensity of those price changes relative to the volume traded.
By monitoring these two metrics simultaneously, traders can better understand the underlying dynamics of the market, helping to distinguish between high-velocity "sprints" and more sustainable, volume-supported trends.
//+------------------------------------------------------------------+
//|                                                 EES-Velocity.mq4 |
//|                             Copyright © 2011, Elite E Services   |
//|  http://www.eliteeservices.net          http://www.getfxnow.com  |
//|                                                                  |
//|Support:  http://www.eesfx.com  Group:  http://www.forexcoding.com|
//|Elite E Services (646)837-0059                                    |
//|1201 Main Street  Columbia, SC 29201    Suite 1980                |
//+------------------------------------------------------------------+

#property copyright "Copyright © 2011, Elite E Services"
#property link      "http://www.eesfx.com"

#property indicator_separate_window
#property indicator_buffers 2
#property indicator_color1 Green
#property indicator_color2 Gold

extern int
   Time_Input      = 0; //0= Seconds,1=Minute,2=hours,3=Day
   //Instructions:  Copy to /indicators folder and load onto chart.  Time frame does not matter as time is defined by time input setting.

double VBuff[];
double VTBuff[];
double TempBuffer[];
int MyDigits;
double MyPoint;
   string short_name;
int BARS;
//+------------------------------------------------------------------+
//| expert initialization function                                   |
//+------------------------------------------------------------------+
int init()
  {
//----
  if(Digits==5)MyDigits=4;
  else if(Digits==3)MyDigits=2;
  else MyDigits = Digits;
  if (Point == 0.00001) MyPoint = 0.0001; //6 digits
  else if (Point == 0.001) MyPoint = 0.01; //3 digits (for Yen based pairs)
  else MyPoint = Point; //Normal
//---- indicators

//---- 1 additional buffer used for counting.
   IndicatorBuffers(3);
//---- indicator line
   SetIndexStyle(0,DRAW_LINE);
   SetIndexBuffer(0,VBuff);
   SetIndexStyle(1,DRAW_LINE);
   SetIndexBuffer(1,VTBuff);
   SetIndexBuffer(1,TempBuffer);
//---- name for DataWindow and indicator subwindow label
   string type = "Seconds";
   if(Time_Input == 1)type = "Minutes";
   if(Time_Input == 2)type = "Hours";
   if(Time_Input == 3)type = "Days";
   short_name="EES Velocity("+type+")";
   IndicatorShortName(short_name);
   SetIndexLabel(0,"Volatility("+type+")");
   SetIndexLabel(1,"VTick");
//----
   SetIndexDrawBegin(0,10);
//----
   return(0);
  }
//+------------------------------------------------------------------+
//| Custom indicator deinitialization function                       |
//+------------------------------------------------------------------+
int deinit()
  {
//----
   ObjectsDeleteAll( 0, OBJ_TEXT);
//----
   return(0);
  }
//+------------------------------------------------------------------+
//| Custom indicator iteration function                              |
//+------------------------------------------------------------------+
int start()
  {
   int i,counted_bars=IndicatorCounted();
//----
   if(Bars<=5) return(0);
//---- initial zero
   if(counted_bars<1)
      for(i=1;i<=5;i++) VBuff[Bars-i]=0.0;
//----
   i=Bars-counted_bars-1;

   BARS = Bars;

//----
   if(counted_bars>0) counted_bars--;
   int limit=Bars-counted_bars;
   for(i=0; i<limit; i++)
   {
      double TIME = iTime(Symbol(),0,i)-iTime(Symbol(),0,i+1);
      if(i==0)TIME = TimeCurrent()-iTime(Symbol(),0,0);
      if(Time_Input==1)TIME = TIME/60;
      if(Time_Input==2)TIME = TIME/(60*60);
      if(Time_Input==3)TIME = TIME/(60*1440);
      if(i==0)Print("TIME= "+TIME);
      VBuff[i]=((High[i]-Low[i])/TIME)/Point;
      VTBuff[i]=((High[i]-Low[i])/Volume[i])/Point;
   }
   return(0);
  }
//+------------------------------------------------------------------+
Comments