Donchian
Download script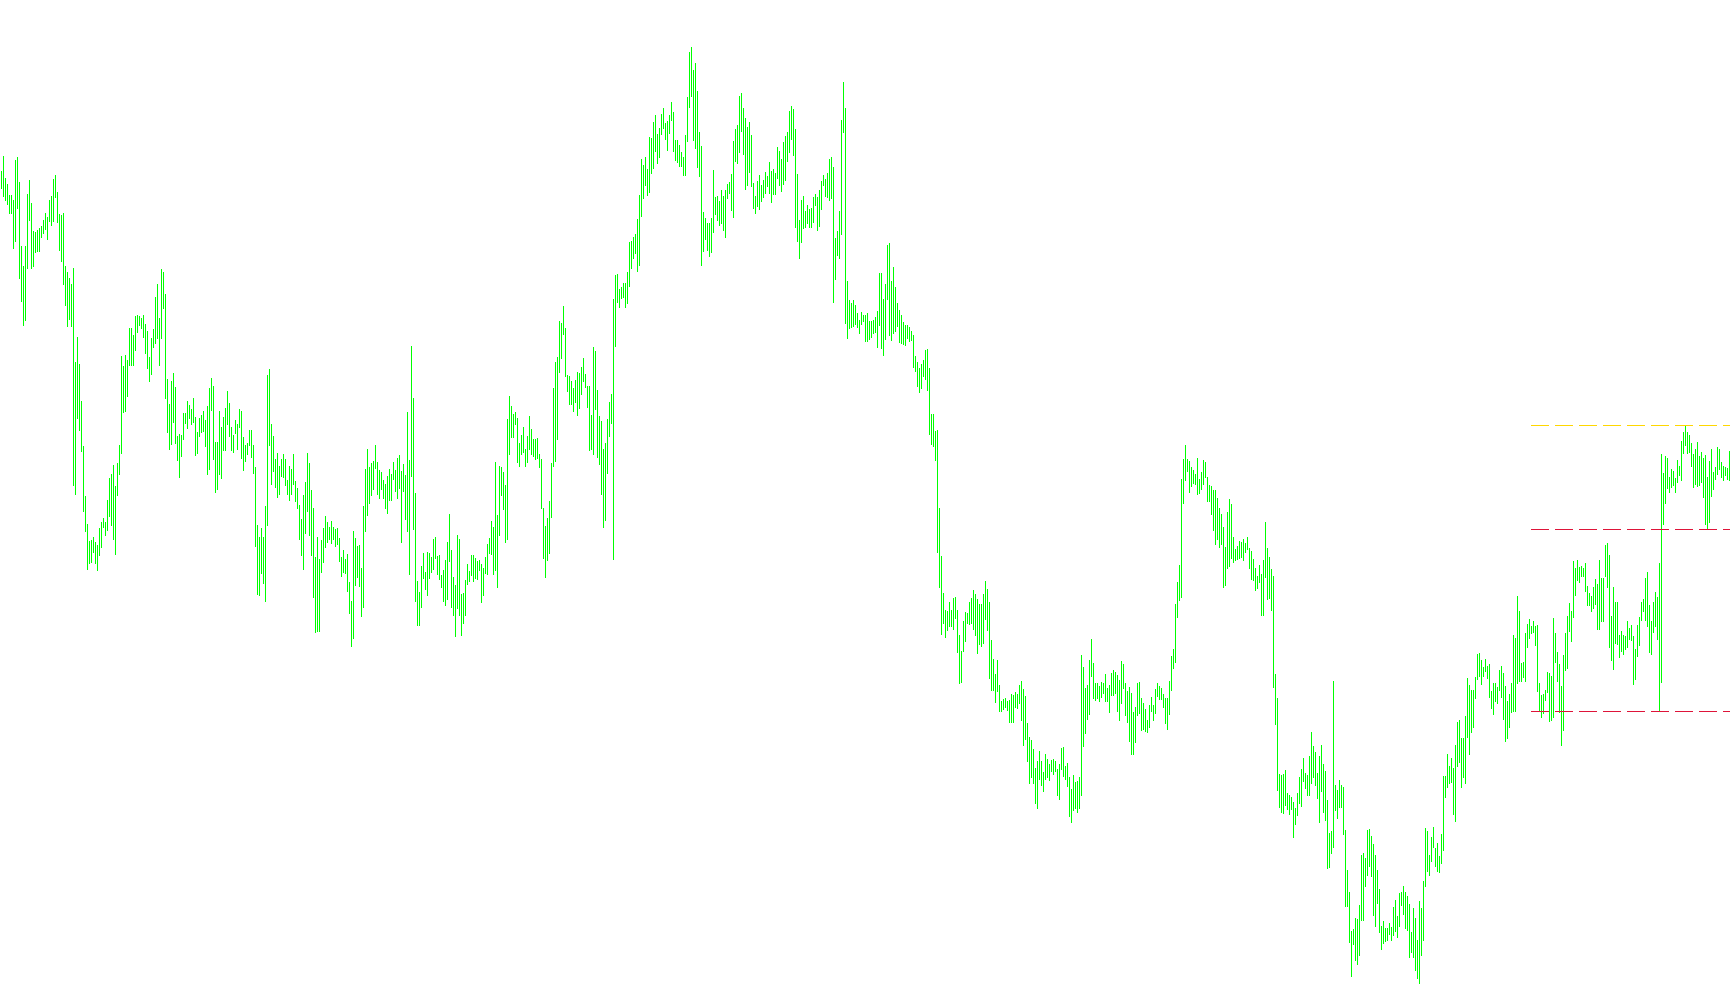
This script is a visual analysis tool designed to help traders identify significant price boundaries by calculating historical highs and lows over two different time horizons. By plotting these levels directly on the chart, it allows users to see where the market has recently peaked or bottomed out, providing a clearer picture of potential support and resistance zones.
Core Logic Overview
The script operates by looking at the price history and identifying specific "extreme" values based on two distinct observation windows:
- Short-Term Analysis: The tool monitors a smaller number of recent candles (the default is set to 25). It scans this timeframe to find the highest point reached and the lowest point dropped.
- Long-Term Analysis: Simultaneously, the tool monitors a larger window of historical data (the default is set to 50 candles). This identifies broader price extremes that represent more significant structural movements.
Key Features and Visuals
- Dynamic Level Plotting: The script automatically draws four horizontal dashed lines on your chart:
- Two Resistance/Support levels based on the short-term window (representing immediate volatility).
- Two Extended Resistance/Support levels based on the long-term window (representing broader market trends).
- Color Coding: To make the data easy to read at a glance, the script uses distinct colors—typically Gold for maximums (highs) and Crimson for minimums (lows).
- Real-Time Labels: Next to these lines, the script places text labels. These labels dynamically update to show the exact price value of each level and confirm which timeframe (Short or Long) that specific line belongs to.
- On-Screen Statistics: In the corner of the chart area, the tool provides a live calculation of the "Channel Variation." This tells you the total price distance between the highest high and the lowest low for both your short and long time periods, expressed in points.
How it Helps the Trader
Instead of forcing you to manually scan back through dozens of candles to find where the price "turned around," this script does that work instantly. It provides a snapshot of the current trading "envelope." By seeing the difference between the Short-Term and Long-Term levels, you can better understand whether the current price action is contained within a tight, local range or if it is reacting to much larger historical boundaries.
//+------------------------------------------------------------------+
//|                                                Donchian.mq4 |
//|                                                   Andrei Andreev |
//|                                             http://www.andand.ru |
//+------------------------------------------------------------------+

// BASED ON:
//+------------------------------------------------------------------+
//|                                                   ^X_Sensors.mq4 |
//|                                                    Version 2.0.1 |
//|------------------------------------------------------------------|
//|                     Copyright © 2007, Mr.WT, Senior Linux Hacker |
//|                                     http://w-tiger.narod.ru/wk2/ |
//+------------------------------------------------------------------+
#property copyright "Andrei Andreev"
#property link      "http://www.andand.ru"

#property indicator_chart_window

extern int Period_Short=25;
extern int Period_Long=50;
extern int _Shift = 100;
extern color Max_Color = Gold;
extern color Min_Color = Crimson;


int _N_Time, ObjectId;
string OBJECT_PREFIX = "LEVELS";
//-------------------------------------------------------------------------------------------
int init() {

color _S_Color=Max_Color;
color _R_Color=Min_Color;


_N_Time = 0;

ObjectCreate("S1 line", OBJ_TREND, 0, Time[_Shift], 0, Time[0], 0);
ObjectCreate("S2 line", OBJ_TREND, 0, Time[_Shift], 0, Time[0], 0);
ObjectCreate("R1 line", OBJ_TREND, 0, Time[_Shift], 0, Time[0], 0);
ObjectCreate("R2 line", OBJ_TREND, 0, Time[_Shift], 0, Time[0], 0);


ObjectSet("S1 line", OBJPROP_RAY, 1);
ObjectSet("S1 line", OBJPROP_STYLE, STYLE_DASH);
ObjectSet("S1 line", OBJPROP_COLOR, _S_Color);

ObjectSet("S2 line", OBJPROP_RAY, 1);
ObjectSet("S2 line", OBJPROP_STYLE, STYLE_DASH);
ObjectSet("S2 line", OBJPROP_COLOR, _S_Color);


ObjectSet("R1 line", OBJPROP_RAY, 1);
ObjectSet("R1 line", OBJPROP_STYLE, STYLE_DASH);
ObjectSet("R1 line", OBJPROP_COLOR, _R_Color);

ObjectSet("R2 line", OBJPROP_RAY, 1);
ObjectSet("R2 line", OBJPROP_STYLE, STYLE_DASH);
ObjectSet("R2 line", OBJPROP_COLOR, _R_Color);


ObjectCreate("R1 label", OBJ_TEXT, 0, Time[0], 0);
ObjectCreate("R2 label", OBJ_TEXT, 0, Time[0], 0);
ObjectCreate("S1 label", OBJ_TEXT, 0, Time[0], 0);
ObjectCreate("S2 label", OBJ_TEXT, 0, Time[0], 0);

ObjectId = 0;
return(0);
}
//-------------------------------------------------------------------------------------------
int deinit() {


ObjectDelete("R1 label");
ObjectDelete("R1 line");
ObjectDelete("R2 label");
ObjectDelete("R2 line");

ObjectDelete("S1 label");
ObjectDelete("S1 line");
ObjectDelete("S2 label");
ObjectDelete("S2 line");


ObDeleteObjectsByPrefix(OBJECT_PREFIX);
return(0);
}
//+------------------------------------------------------------------+
//| Custom indicator iteration function |
//+------------------------------------------------------------------+
int start() {

color _S_Color=Max_Color;
color _R_Color=Min_Color;

if ( _N_Time == Time[0] ) return(0);

double R1, R2, S1, S2,MaxHigh,MinLow,Long_MaxHigh,Long_MinLow;

double _rates[][6];
double rangeH[100];
double rangeL[100];
double long_rangeH[100];
double long_rangeL[100];

ArrayCopyRates(_rates, NULL, 0);
int err = GetLastError();
if(err == 4066) {
  Sleep(1000);
  if(iClose(NULL,0, 0) != Close[0]) {
    Sleep(1000);
    return(0);
  }
}


for (int i=1;i<Period_Short+1;i++){rangeH[i-1]=_rates[i][3];rangeL[i-1]=_rates[i][2];}
for (i=1;i<Period_Long+1;i++) {long_rangeH[i-1]=_rates[i][3];long_rangeL[i-1]=_rates[i][2];}

MaxHigh=rangeH[ArrayMaximum(rangeH,Period_Short,0)];
MinLow=rangeL[ArrayMinimum(rangeL,Period_Short,0)];

Long_MaxHigh=long_rangeH[ArrayMaximum(long_rangeH,Period_Long,0)];
Long_MinLow=long_rangeL[ArrayMinimum(long_rangeL,Period_Long,0)];


Comment( "\nÄèàïàçîí êàíàëà çà ",Period_Short," áàðîâ: ",(MaxHigh-MinLow)/Point,
         "\nÄèàïàçîí êàíàëà çà ",Period_Long," áàðîâ: ",(Long_MaxHigh-Long_MinLow)/Point);


R1 =MinLow;
R2 =Long_MinLow;

S1 =MaxHigh;
S2 =Long_MaxHigh;


string s1,s2,r1,r2;

  s1 = DoubleToStr(S1, Digits);
  s2 = DoubleToStr(S2, Digits);

  r1 = DoubleToStr(R1, Digits);
  r2 = DoubleToStr(R2, Digits);


//---- Pivot Lines
ObjectSetText("R1 label", "                          Min çà "+Period_Short+" áàðîâ "+r1+"", 8, "Fixedsys", _R_Color);
ObjectSetText("R2 label", "                          Min çà "+Period_Long+" áàðîâ "+r2+"", 8, "Fixedsys", _R_Color);

ObjectSetText("S1 label", "                          Max çà "+Period_Short+" áàðîâ "+s1+"", 8, "Fixedsys", _S_Color);
ObjectSetText("S2 label", "                          Max çà "+Period_Long+" áàðîâ "+s2+"", 8, "Fixedsys", _S_Color);


ObjectMove("R1 label", 0, Time[0], R1);
ObjectMove("R2 label", 0, Time[0], R2);


ObjectMove("S1 label", 0, Time[0], S1);
ObjectMove("S2 label", 0, Time[0], S2);


ObjectMove("S1 line", 0, Time[_Shift], S1);
ObjectMove("S1 line", 1, Time[0], S1);

ObjectMove("S2 line", 0, Time[_Shift], S2);
ObjectMove("S2 line", 1, Time[0], S2);


ObjectMove("R1 line", 0, Time[_Shift], R1);
ObjectMove("R1 line", 1, Time[0], R1);

ObjectMove("R2 line", 0, Time[_Shift], R2);
ObjectMove("R2 line", 1, Time[0], R2);


_N_Time = Time[0];
//---- End Of Program
return(0);
}
//+------------------------------------------------------------------+


void ObDeleteObjectsByPrefix(string Prefix)
  {
   int L = StringLen(Prefix);
   int i = 0;
   while(i < ObjectsTotal())
     {
       string ObjName = ObjectName(i);
       if(StringSubstr(ObjName, 0, L) != Prefix)
         {
           i++;
           continue;
         }
       ObjectDelete(ObjName);
     }
  }
//-------------------------------------------------------------------------------------------
Comments