DigFiltr
Download script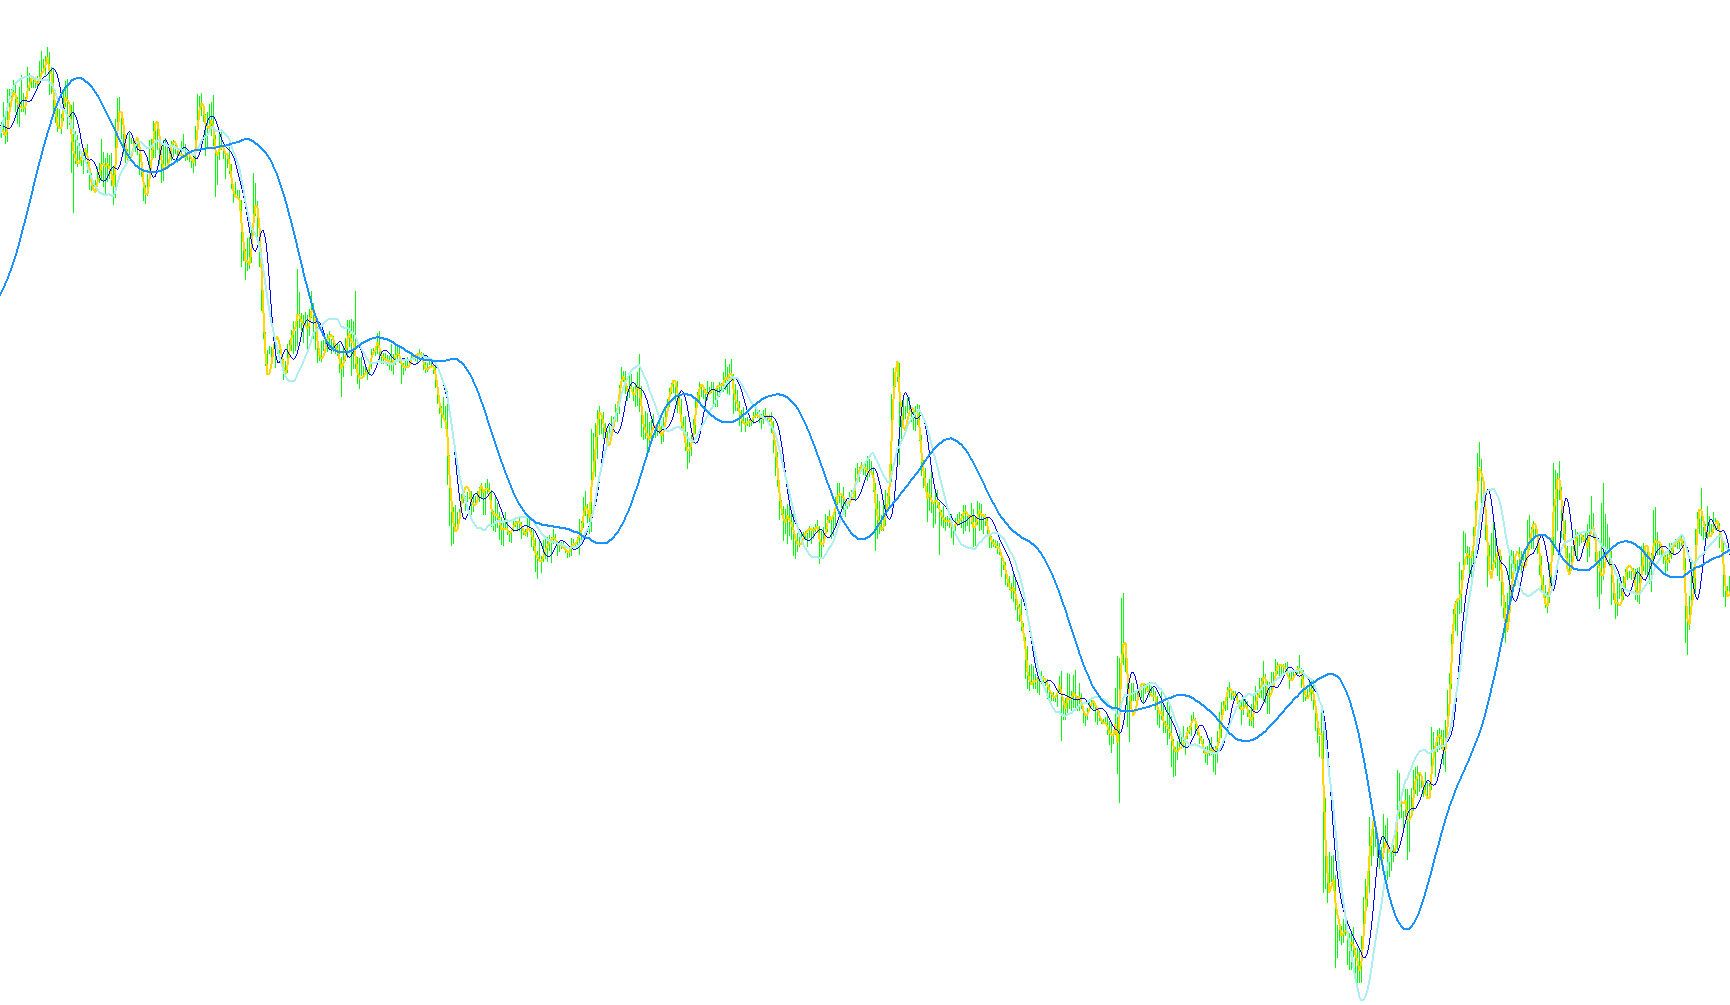
This script is designed as a technical analysis tool for trading platforms, specifically intended to help users visualize complex price movements by smoothing out market "noise." It creates four distinct data lines on a chart based on the closing prices of assets over specific timeframes.
Core Logic and Methodology
The tool operates using a mathematical technique where it takes historical price data and applies a unique set of "weights" to each piece of information. Instead of simply looking at the current price, the script looks back at a specific number of previous candles (ranging from 39 to 91) and calculates a weighted average for each.
The Four Data Streams: The script produces four different lines on your chart, each representing a different sensitivity level:
- FATL: Uses a short timeframe of 39 periods.
- RFTL: Uses a medium timeframe of 44 periods.
- SATL: Uses a longer timeframe of 65 periods.
- RSTL: Uses the longest timeframe of 91 periods.
By using different weights for these periods, the script allows you to see both rapid shifts in price (the shorter lines) and long-term trends (the longer lines) simultaneously.
Comparative Analysis (Trend Detection)
Beyond simply drawing lines, the logic behind this script is designed to compare these different timeframes against one another. It calculates the "distance" or difference between these lines to determine the momentum of the market.
The script internally evaluates three specific relationships:
- Short-term vs. Medium-term: It compares the FATL and RFTL lines to see if the immediate trend is accelerating or decelerating compared to the slightly broader trend.
- Short-term vs. Long-term: It compares the FATL and SATL lines to identify how the current price action relates to the overall primary trend.
- Medium-term vs. Long-term: It compares the SATL and RSTL lines to observe the health of the underlying long-term market structure.
Visual Interpretation
For the user, this logic provides a multi-layered view of the market. Because the script calculates whether these differences are increasing or decreasing between one candle and the next, it helps identify:
- Momentum Shifts: When the gap between two lines widens, it suggests the trend is gaining strength.
- Trend Exhaustion: When the gap begins to narrow, it may suggest that the current move is losing steam.
- Confluence: By watching all four lines together, a user can see where short-term momentum aligns with long-term trends, providing a more comprehensive picture of market behavior than a single price line could offer alone.
//+------------------------------------------------------------------+
//|                                                         FATL.mq4 |
//|                      Copyright © 2004, MetaQuotes Software Corp. |
//|                                        http://www.metaquotes.net |
//+------------------------------------------------------------------+
#property copyright "Copyright © 2004, MetaQuotes Software Corp."
#property link      "http://www.metaquotes.net"

#property indicator_chart_window
#property indicator_buffers 4
#property indicator_color1 Violet
#property indicator_color2 Aquamarine
#property indicator_color3 Wheat
#property indicator_color4 IndianRed
//---- buffers
double FATLBuffer[];
double RFTLBuffer[];
double SATLBuffer[];
double RSTLBuffer[];
//+------------------------------------------------------------------+
//| FATL weights                                                     |
//+------------------------------------------------------------------+
#define FATLPeriods 39
#define RFTLPeriods 44
#define SATLPeriods 65
#define RSTLPeriods 91

double g_FATLKoef[FATLPeriods]=
  { 0.4360409450,    0.3658689069,    0.2460452079,    0.1104506886,   -0.0054034585,
   -0.0760367731,   -0.0933058722,   -0.0670110374,   -0.0190795053,    0.0259609206,
    0.0502044896,    0.0477818607,    0.0249252327,   -0.0047706151,   -0.0272432537,
   -0.0338917071,   -0.0244141482,   -0.0055774838,    0.0128149838,    0.0226522218,
    0.0208778257,    0.0100299086,   -0.0036771622,   -0.0136744850,   -0.0160483392,
   -0.0108597376,   -0.0016060704,    0.0069480557,    0.0110573605,    0.0095711419,
    0.0040444064,   -0.0023824623,   -0.0067093714,   -0.0072003400,   -0.0047717710,
    0.0005541115,    0.0007860160,    0.0130129076,    0.0040364019  };

double g_RFTLKoef[RFTLPeriods]=
 {-0.0025097319, +0.0513007762 , +0.1142800493 , +0.1699342860 , +0.2025269304 ,
  +0.2025269304, +0.1699342860 , +0.1142800493 , +0.0513007762 , -0.0025097319 ,
  -0.0353166244, -0.0433375629 , -0.0311244617 , -0.0088618137 , +0.0120580088 ,
  +0.0233183633, +0.0221931304 , +0.0115769653 , -0.0022157966 , -0.0126536111 ,
  -0.0157416029, -0.0113395830 , -0.0025905610 , +0.0059521459 , +0.0105212252 ,
  +0.0096970755, +0.0046585685 , -0.0017079230 , -0.0063513565 , -0.0074539350 ,
  -0.0050439973, -0.0007459678 , +0.0032271474 , +0.0051357867 , +0.0044454862 ,
  +0.0018784961, -0.0011065767 , -0.0031162862 , -0.0033443253 , -0.0022163335 ,
  +0.0002573669, +0.0003650790 , +0.0060440751 , +0.0018747783 };

double g_SATLKoef[SATLPeriods]=
 {0.0982862174 ,+0.0975682269 ,+0.0961401078 ,+0.0940230544 ,+0.0912437090 ,+0.0878391006 ,
 +0.0838544303 ,+0.0793406350 ,+0.0743569346 ,+0.0689666682 ,+0.0632381578 ,+0.0572428925 ,
 +0.0510534242 ,+0.0447468229 ,+0.0383959950 ,+0.0320735368 ,+0.0258537721 ,+0.0198005183 ,
 +0.0139807863 ,+0.0084512448 ,+0.0032639979 ,-0.0015350359 ,-0.0059060082 ,-0.0098190256 ,
 -0.0132507215 ,-0.0161875265 ,-0.0186164872 ,-0.0205446727 ,-0.0219739146 ,-0.0229204861 ,
 -0.0234080863 ,-0.0234566315 ,-0.0231017777 ,-0.0223796900 ,-0.0213300463 ,-0.0199924534 ,
 -0.0184126992 ,-0.0166377699 ,-0.0147139428 ,-0.0126796776 ,-0.0105938331 ,-0.0084736770 ,
 -0.0063841850 ,-0.0043466731 ,-0.0023956944 ,-0.0005535180 ,+0.0011421469 ,+0.0026845693 ,
 +0.0040471369 ,+0.0052380201 ,+0.0062194591 ,+0.0070340085 ,+0.0076266453 ,+0.0080376628 ,
 +0.0083037666 ,+0.0083694798 ,+0.0082901022 ,+0.0080741359 ,+0.0077543820 ,+0.0073260526 ,
 +0.0068163569 ,+0.0062325477 ,+0.0056078229 ,+0.0049516078,+0.0161380976 };


double g_RSTLKoef[RSTLPeriods]=
 {-0.0074151919,-0.0060698985,-0.0044979052,-0.0027054278,-0.0007031702,+0.0014951741,
  +0.0038713513,+0.0064043271,+0.0090702334,+0.0118431116,+0.0146922652,+0.0175884606,
  +0.0204976517,+0.0233865835,+0.0262218588,+0.0289681736,+0.0315922931,+0.0340614696,
  +0.0363444061,+0.0384120882,+0.0402373884,+0.0417969735,+0.0430701377,+0.0440399188,
  +0.0446941124,+0.0450230100,+0.0450230100,+0.0446941124,+0.0440399188,+0.0430701377,
  +0.0417969735,+0.0402373884,+0.0384120882,+0.0363444061,+0.0340614696,+0.0315922931,
  +0.0289681736,+0.0262218588,+0.0233865835,+0.0204976517,+0.0175884606,+0.0146922652,
  +0.0118431116,+0.0090702334,+0.0064043271,+0.0038713513,+0.0014951741,-0.0007031702,
  -0.0027054278,-0.0044979052,-0.0060698985,-0.0074151919,-0.0085278517,-0.0094111161,
  -0.0100658241,-0.0104994302,-0.0107227904,-0.0107450280,-0.0105824763,-0.0102517019,
  -0.0097708805,-0.0091581551,-0.0084345004,-0.0076214397,-0.0067401718,-0.0058083144,
  -0.0048528295,-0.0038816271,-0.0029244713,-0.0019911267,-0.0010974211,-0.0002535559,
  +0.0005231953,+0.0012297491,+0.0018539149,+0.0023994354,+0.0028490136,+0.0032221429,
  +0.0034936183,+0.0036818974,+0.0038037944,+0.0038338964,+0.0037975350,+0.0036986051,
  +0.0035521320,+0.0033559226,+0.0031224409,+0.0028550092,+0.0025688349,+0.0022682355,
  +0.0073925495 };


//+------------------------------------------------------------------+
//| Custom indicator initialization function                         |
//+------------------------------------------------------------------+
int init()
  {
//---- indicators
   IndicatorBuffers(4);
   SetIndexStyle(0,DRAW_LINE,STYLE_SOLID,2);
   SetIndexBuffer(0, FATLBuffer);
   SetIndexDrawBegin(0,39);

   SetIndexStyle(1,DRAW_LINE,STYLE_SOLID,1);
   SetIndexBuffer(1, RFTLBuffer);
   SetIndexDrawBegin(1,44);

   SetIndexStyle(2,DRAW_LINE,STYLE_SOLID,2);
   SetIndexBuffer(2, SATLBuffer);
   SetIndexDrawBegin(2,65);

   SetIndexStyle(3,DRAW_LINE,STYLE_SOLID,2);
   SetIndexBuffer(3, RSTLBuffer);
   SetIndexDrawBegin(3,91);
//----
   return(0);
  }
//+------------------------------------------------------------------+
//| Custor indicator deinitialization function                       |
//+------------------------------------------------------------------+
int deinit()
  {
//---- TODO: add your code here

//----
   return(0);
  }
//+------------------------------------------------------------------+
//| Custom indicator iteration function                              |
//+------------------------------------------------------------------+
int start()
{
   int    counted_bars=IndicatorCounted();
//---- TODO: add your code here

   int    j,pos;
   double sum1,sum2,sum3,sum4;
//----
   if(counted_bars<0)  return(-1);
   //if (counted_bars>0) counted_bars--;


//---- main calculation loop
   for (pos=Bars-counted_bars-1;pos>=0;pos--)
     {

      sum1=0;          // zero summary
	for(j=0;j<FATLPeriods;j++)
		sum1+=g_FATLKoef[j]*Close[pos+j];//Counted FATL[pos]

	FATLBuffer[pos]=sum1;

	   sum2=0;          // zero summary
      for(j=0;j<RFTLPeriods;j++) sum2+=g_RFTLKoef[j]*Close[pos+j];//Counted RFTL[pos]
	   RFTLBuffer[pos]=sum2;

	   sum3=0;          // zero summary
      for(j=0;j<SATLPeriods;j++) sum3+=g_SATLKoef[j]*Close[pos+j];//Counted SATL[POS]
	   SATLBuffer[pos]=sum3;

	   sum4=0;          // zero summary
      for(j=0;j<RSTLPeriods;j++) sum4+=g_RSTLKoef[j]*Close[pos+j];//Counted RSTL[pos]
	   RSTLBuffer[pos]=sum4;

	   int FARF=MathRound((sum1-sum2)/Point);
	   int FARFPrev=MathRound((FATLBuffer[pos+1]-RFTLBuffer[pos+1])/Point);
	   if (FARF>FARFPrev) string FAR="UP"; else FAR="DOWN";

	   int FASA=MathRound((sum1-sum3)/Point);
	   int FASAPrev=MathRound((FATLBuffer[pos+1]-SATLBuffer[pos+1])/Point);
	   if (FASA>FASAPrev) string FAS="UP"; else FAS="DOWN";

	   int SARS=MathRound((sum3-sum4)/Point);
	   int SARSPrev=MathRound((SATLBuffer[pos+1]-RSTLBuffer[pos+1])/Point);
	   if (SARS>SARSPrev) string SAS="UP"; else SAS="DOWN";


     }
   /*Comment("   FARF = ",FARF ,"         ", FAR, "\n",
           "   FASA = ",FASA ,"         ", FAS, "\n",
           "   SARS = ",SARS ,"         ", SAS, "\n",
           "   RSTL= ",sum4 );*/
   return(0);
}
//+------------------------------------------------------------------+
Comments