!corelation
Download script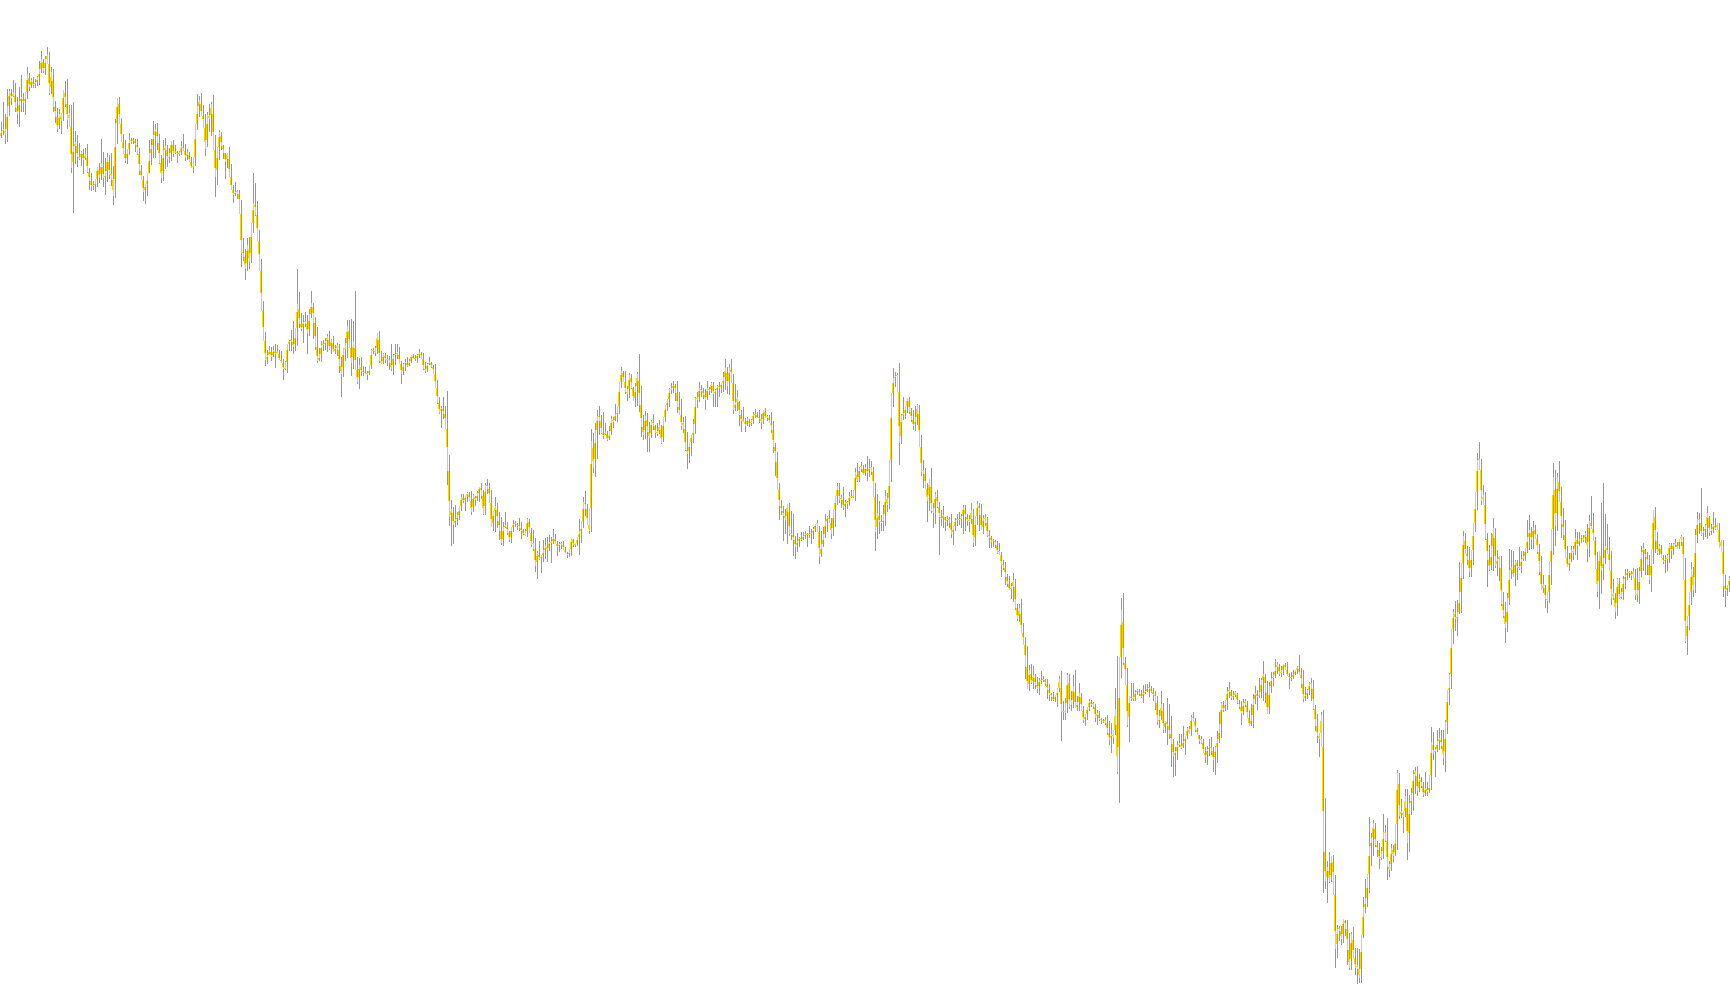
This tool is designed to help traders visualize the relationship between two different financial instruments (such as two different currencies or assets) on a single chart. By overlaying one symbol onto another, it allows you to see how closely they move together in real-time, which is essential for identifying correlations, hedging opportunities, and spread trading strategies.
How it Works
The script performs a sophisticated visual alignment to ensure that the two different instruments can be compared accurately, even if they have completely different price values. It accomplishes this through three main logical steps:
1. Dynamic Price Scaling Because one asset might trade at 100.00 while another trades at 1.50, simply placing them on the same chart would make one look like a flat line. The script looks back at a specific number of historical bars (which you can customize) to find the highest and lowest price points for both symbols. It then calculates a "scale factor" to shrink or expand the data so that both assets fit perfectly within the same visual window.
2. Intelligent Alignment (Offsetting) Once the sizes are adjusted, the script calculates an "offset." This ensures that if both assets reach their respective peaks at the same time, those peaks will align on the screen. This creates a synchronized view where you can see if one asset is consistently leading, lagging, or mirroring the other.
3. Visual Options and Customization The logic includes several flexible settings to tailor the visual output:
- Inversion: You can flip the chart of the second symbol upside down. This is useful for finding "inverse correlations" (where one asset goes up as the other goes down).
- Moving Averages: You can choose to display a Moving Average for the overlaid symbol. This helps smooth out price action to see the broader trend of the correlation.
- MA Only Mode: For a cleaner look, you can choose to hide the actual price line of the second symbol and view only its Moving Average.
Summary for Traders
By using this tool, you eliminate the guesswork of switching between tabs or windows. It provides a "side-by-side" visual experience where both assets occupy the same space, making it much easier to spot patterns, synchronized movements, and potential trading opportunities based on how these two markets interact.
//+---------------------------------------------------------------------------------+
//|                                                   corelation.mq4                |
//|                                Copyright © 2008, Borys Chekmasov                |
//|                                     http://uatrader.blogspot.com                |
//+---------------------------------------------------------------------------------+
/*
Description:

The indicator is intended for searching the correlations between different symbols. It allows you to overlay
one chart with another to visually detect how different symbols correlate with each other. It also allows
you to superimpose moving averages.
Inputs:

    * simbol_name - the ticker of the symbol whose chart will be layed on the current one;
    * bars_for_autoscale - the amount of bars the charts will be scaled on (0 - maximal amount);
    * inverse - inverses the chart upside down;
    * MA - show or not to the moving average for the overlaid chart (true - show; false - do not show);
    * MAPeriod - the period of the moving average;
    * MAOnly - shows only the moving average (hides chart).

The scaling occurs in the way the maximums and minimums at the region of N-bars (bars_for_autoscale variable) coincide with each other.

The indicator can be used for hedging and spread trade strategies on correlating pairs.
*/

#property copyright "Copyright © 2008, Borys Chekmasov"
#property link      "http://uatrader.blogspot.com"

#property indicator_chart_window
#property indicator_buffers 2
#property indicator_color1 Gold
#property indicator_color2 DodgerBlue
//âõîäíûå ïàðàìåòðû
extern string simbol_name = "EURUSD";
extern int bars_for_autoscale = 200;
extern bool inverse = false;
extern bool MA = false;
extern int MAPeriod =14;
extern bool MAOnly = false;

double simbolBuffer[];
double MABuffer[];

// èíèöèàëèçàöèÿ
int init()
  {
   SetIndexBuffer(0,simbolBuffer);
   SetIndexStyle (0,DRAW_LINE);
      SetIndexBuffer(1,MABuffer);
   SetIndexStyle (1,DRAW_LINE);
   return (0);
  }

//îñíîâíîé öèêë

int start()
  {
double simbol_scale = 1;
double simbol_offset = 0;
 int i,k;
int cb=IndicatorCounted();
i = Bars-cb-1;
k = bars_for_autoscale;
if (bars_for_autoscale==0) k=Bars;
double max_scale=iClose(simbol_name,0,1);
double min_scale=iClose(simbol_name,0,1);
double max_scale2=Close[1];
double min_scale2=Close[1];
while(k>=0)
      {

      if (max_scale<iClose(simbol_name,0,k)) max_scale=iClose(simbol_name,0,k);
      if (min_scale>iClose(simbol_name,0,k)) min_scale=iClose(simbol_name,0,k);
      if (max_scale2<Close[k])max_scale2=Close[k];
      if (min_scale2>Close[k])min_scale2=Close[k];


      k--;
      }

simbol_scale = (max_scale2 - min_scale2)/(max_scale-min_scale);
      if(!inverse) {
 simbol_offset = max_scale2 - simbol_scale*max_scale;
 }
 else
 {
 simbol_offset = max_scale2 + simbol_scale*min_scale;
 }

while(i>=0)
      {

        if(!inverse)
        {
         if (!MAOnly) simbolBuffer[i]=simbol_scale*(iClose(simbol_name,0,i))+simbol_offset;
         if (MA)MABuffer[i]=(iMA(simbol_name,0,MAPeriod,0,0,PRICE_CLOSE,i))*simbol_scale+simbol_offset;
         }
        else
        {
        if (!MAOnly) simbolBuffer[i]=simbol_offset - simbol_scale*(iClose(simbol_name,0,i));
        if (MA)MABuffer[i]=simbol_offset - simbol_scale*(iMA(simbol_name,0,MAPeriod,0,0,PRICE_CLOSE,i));
        }
          i--;
      }


   return(0);
  }
Comments