CCI_T3
Download script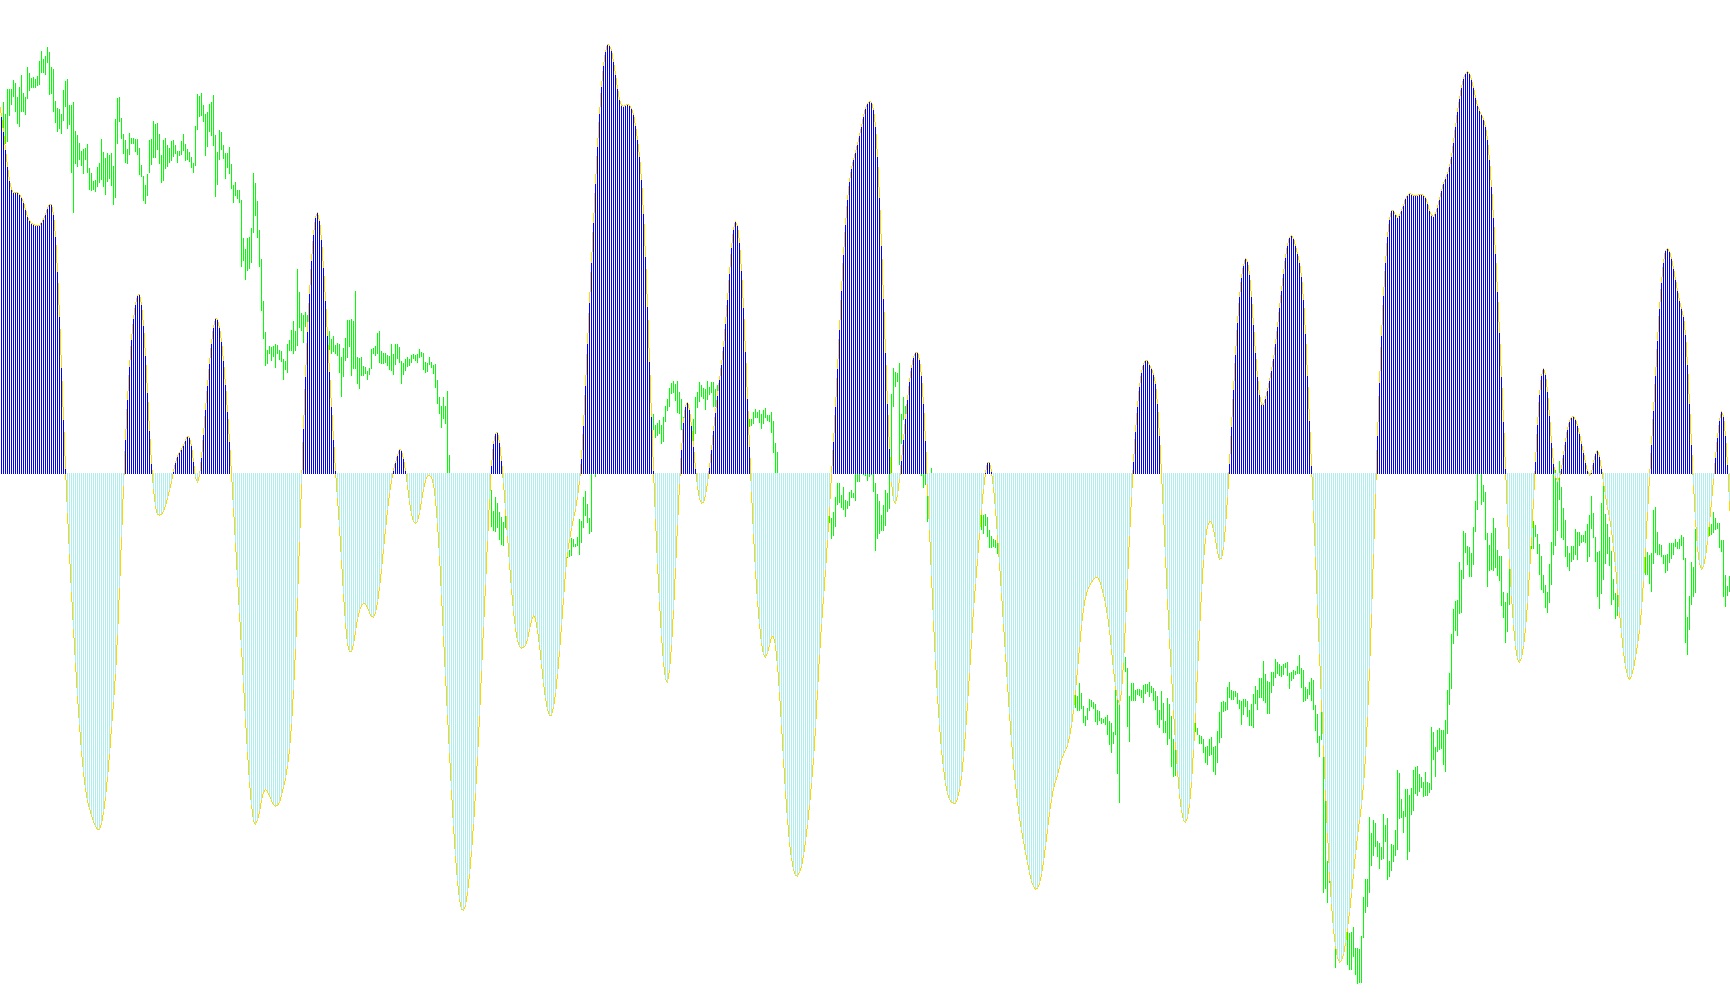
Overview
The FX Sniper's T3 CCI is a specialized technical analysis tool designed for traders to identify price momentum and trend direction on financial charts. It functions by combining two distinct mathematical methodologies: the Commodity Channel Index (CCI) and the T3 Moving Average. By merging these, the script aims to provide a smoother, more refined view of market trends compared to standard indicators that may produce "noisy" or erratic signals.
How it Works
The logic behind this indicator can be broken down into three primary layers:
1. The Foundation: Commodity Channel Index (CCI) At its core, the script uses the CCI, which measures where the current price is relative to its average price over a specific period. In simple terms, it tells you if the market is currently "overbought" or "oversold."
2. The Refinement: The T3 Smoothing Logic Unlike standard moving averages that can lag behind price movements, this script applies a specialized "T3" calculation. This is a sophisticated smoothing technique that uses multiple layers of weighted averages to eliminate market "noise" (random price fluctuations) while maintaining the responsiveness of the trend. It essentially acts as a filter that clarifies the direction of the CCI without making it sluggish.
3. Visual Representation & Signal Detection The script translates these complex calculations into three visual components on your chart:
- The Main Line: A continuous blue line represents the primary smoothed trend. This allows you to see the overall "flow" of the market momentum.
- The Upward Histogram (Lime Green): When the calculated value is positive (above the zero line), a green histogram appears. This highlights bullish momentum where the price strength is trending upwards.
- The Downward Histogram (Red): When the calculated value is negative (below the zero line), a red histogram appears. This highlights bearish momentum where the price strength is trending downwards.
Key Features for the User
- Zero-Line Reference: The indicator features a distinct gold dashed line at the zero level. This serves as the "balance point." Crossings above or below this line typically indicate shifts in market sentiment.
- Customizable Sensitivity: Users can adjust parameters such as the "Period" (how much historical data to look at) and the "T3 Hot" factor, which determines how aggressively the indicator reacts to new price changes.
- Dual-Mode Smoothing: The script allows for different calculation modes (Original vs. Modified), giving users the flexibility to choose between a more traditional smoothing style or one specifically tuned for faster reaction times.
Summary of Use
For a non-technical user, this tool is designed to simplify market reading. Instead of looking at raw, jagged price movements, you can watch the T3 CCI line and the color-coded histograms. When the histogram turns green and the line moves upward, it suggests bullish strength; when it turns red and moves downward, it suggests bearish weakness.
//+------------------------------------------------------------------+
//|                                           FX Sniper's T3 CCI.mq4 |
//|                                                        FX Sniper |
//|                                                                  |
//+------------------------------------------------------------------+
#property copyright "FX Sniper:  T3-CCI :-)"
#property link      "http://dunno.com  :-)/"

#property indicator_separate_window
#property indicator_buffers 3
#property indicator_color1 DodgerBlue
#property indicator_color2 LimeGreen
#property indicator_color3 Red
#property indicator_width1 3
#property indicator_width2 3
#property indicator_width3 3
#property indicator_level1 0
#property indicator_levelstyle STYLE_DASH
#property indicator_levelcolor Gold


extern int    CCI_Period = 14;
extern int    T3Period   = 14;
extern int    T3Price    = PRICE_CLOSE;
extern double T3Hot      = 0.7;
extern bool   T3Original = true;
extern bool   Histogram  = true;


double emas[][6];
double alpha;
double c1;
double c2;
double c3;
double c4;


double cci[];
double cciHup[];
double cciHdn[];


int init()
  {

    SetIndexBuffer(0,    cci);SetIndexStyle(0,      DRAW_LINE);SetIndexLabel(0, "FXST3CCI");
    SetIndexBuffer(1, cciHup);SetIndexStyle(1, DRAW_HISTOGRAM);SetIndexLabel(1,       NULL);
    SetIndexBuffer(2, cciHdn);SetIndexStyle(2, DRAW_HISTOGRAM);SetIndexLabel(2,       NULL);

    double a  = T3Hot;
           c1 = -a*a*a;
           c2 = 3*a*a+3*a*a*a;
           c3 = -6*a*a-3*a-3*a*a*a;
           c4 = 1+3*a+a*a*a+3*a*a;


      T3Period = MathMax(1,T3Period);
      if (T3Original)
           alpha = 2.0/(1.0 + T3Period);
      else alpha = 2.0/(2.0 + (T3Period-1.0)/2.0);


    IndicatorShortName("CCI T3(" + CCI_Period + ", " + T3Period + ")");


    return(0);
  }


   int start()
   {
   int counted_bars=IndicatorCounted();
   int i,limit;

   if(counted_bars<0) return(-1);
   if(counted_bars>0) counted_bars--;
   limit=Bars-counted_bars;
   if (ArrayRange(emas,0) != Bars) ArrayResize(emas,Bars);

       for(i=limit; i>=0; i--){ cci[i] = iT3(iCCI(NULL, 0, CCI_Period, PRICE_TYPICAL, i),i);

       if(Histogram == true)
       {
       if(cci[i] >= 0)
           cciHup[i] = cci[i];
       else
           cciHup[i] = 0;
       //----
       if(cci[i] < 0 )
           cciHdn[i] = cci[i];
       else
           cciHdn[i] = 0;
       }
       }
   return(0);
  }


double iT3(double price,int shift)
{
   int i = Bars-shift-1;
   if (i < 1)
      {
         emas[i][0] = price;
         emas[i][1] = price;
         emas[i][2] = price;
         emas[i][3] = price;
         emas[i][4] = price;
         emas[i][5] = price;
      }
   else
      {
         emas[i][0] = emas[i-1][0]+alpha*(price     -emas[i-1][0]);
         emas[i][1] = emas[i-1][1]+alpha*(emas[i][0]-emas[i-1][1]);
         emas[i][2] = emas[i-1][2]+alpha*(emas[i][1]-emas[i-1][2]);
         emas[i][3] = emas[i-1][3]+alpha*(emas[i][2]-emas[i-1][3]);
         emas[i][4] = emas[i-1][4]+alpha*(emas[i][3]-emas[i-1][4]);
         emas[i][5] = emas[i-1][5]+alpha*(emas[i][4]-emas[i-1][5]);
      }
   return(c1*emas[i][5] + c2*emas[i][4] + c3*emas[i][3] + c4*emas[i][2]);
}
Comments