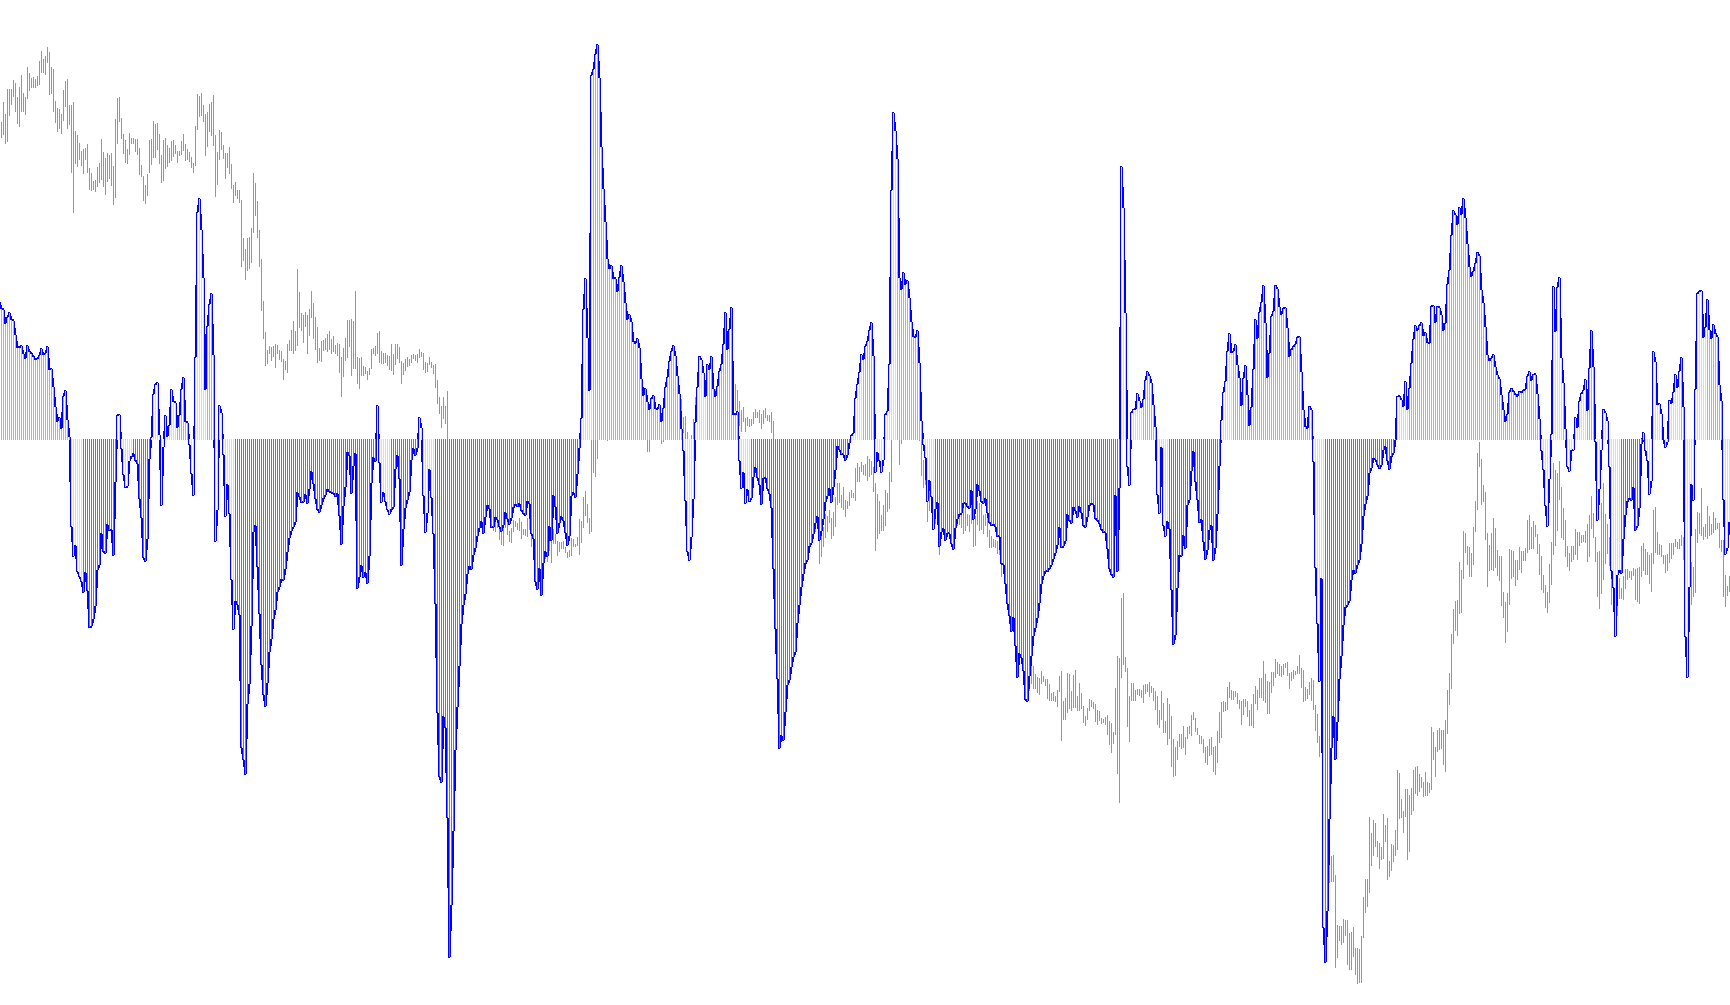
This tool is designed to provide traders with a visual representation of market momentum and "neutrality" by analyzing price fluctuations. It works by processing historical price data to determine whether the current market sentiment is leaning toward a positive trend, a negative trend, or a state of equilibrium (neutrality).
Core Mechanics
The script operates by calculating two distinct layers of market movement:
- Trend Identification: The tool examines price action over two different timeframes simultaneously—a "Fast" period and a "Slow" period. By comparing these, the tool can distinguish between immediate price reactions and the broader underlying trend.
- Sign Detection: It monitors the transition points where momentum shifts from positive to negative (or vice versa). When the data crosses a zero threshold, the script identifies this as a pivot point.
The Neutrality Logic
The unique feature of this logic is its "Neutral Territory" calculation. Instead of simply showing a continuous trend, the script tracks how long the market stays near the zero line after a significant shift in momentum:
- State Tracking: Once a change in direction is detected (moving from positive to negative or vice versa), the tool begins a counting process.
- Neutrality Buffer: If the market remains within a specific "neutral" range for a predefined number of bars, the tool treats this period as a zone of uncertainty or equilibrium.
- Visual Feedback: During these neutral periods, the script provides a specific visual output. Once the market breaks out of this neutral state and sustains momentum, it resumes standard trend identification.
Visual Output
The logic translates these complex calculations into a clear histogram format:
- Blue Elements: Represent periods where the momentum is trending in a positive direction.
- Red Elements: Represent periods where the momentum is trending in a negative direction.
- Neutrality Visualization: By separating these colors, the tool allows you to see at a glance whether the market is actively moving, reversing, or simply "resting" in a neutral zone.
In summary, this script helps filter out market noise by identifying periods where the price lacks a clear direction, allowing traders to visually distinguish between active trends and sideways price action.
//+------------------------------------------------------------------+
//|                                                   WoodiesCCI.mq4 |
//|                                                            thorr |
//|                                        http://www.metaquotes.net |
//+------------------------------------------------------------------+
#property copyright "histogram colour update by thor@gmx.co.uk Moneytec chat: thorr; created by Luis Damiani; converted by Rosh"

#property indicator_separate_window
#property indicator_buffers 5
#property indicator_color1 Yellow
#property indicator_color2 Maroon
#property indicator_color3 DimGray
#property indicator_color4 Red
#property indicator_color5 RoyalBlue
//---- input parameters
extern double       A_period=50;
extern int       B_period=12;
extern int       neutral = 6;
extern int       num_bars=5000;
// parameters
int i=0;
bool initDone=true;
int bar=0;
int prevbars=0;
int startpar=0;
int cs=0;
int prevcs=0;
string commodt="nonono";
int frame=0;
int bars=0;

int count = 0, thisbar = 0;
double now, prev;
bool flag;

//---- buffers
double FastWoodieCCI[];
double SlowWoodieCCI[];
double HistoWoodieCCI[];
double HistoRed[];
double HistoBlue[];
//+------------------------------------------------------------------+
//| Custom indicator initialization function                         |
//+------------------------------------------------------------------+
int init()
  {
//---- indicators
   SetIndexStyle(0,DRAW_LINE,STYLE_SOLID,1);
   SetIndexBuffer(0,FastWoodieCCI);
   SetIndexStyle(1,DRAW_LINE,STYLE_SOLID,2);
   SetIndexBuffer(1,SlowWoodieCCI);
   SetIndexStyle(2,DRAW_HISTOGRAM,STYLE_SOLID,1);
   SetIndexBuffer(2,HistoWoodieCCI);
   SetIndexStyle(3,DRAW_HISTOGRAM,STYLE_SOLID,1);
   SetIndexBuffer(3,HistoRed);
   SetIndexStyle(4,DRAW_HISTOGRAM,STYLE_SOLID,1);
   SetIndexBuffer(4,HistoBlue);
   IndicatorShortName("CCI Histogram ("+A_period+")");
//----
   return(0);
  }
//+------------------------------------------------------------------+
//| Custor indicator deinitialization function                       |
//+------------------------------------------------------------------+
int deinit()
  {
   return(0);
  }
//+------------------------------------------------------------------+
//| Custom indicator iteration function                              |
//+------------------------------------------------------------------+
int start()
  {
   int counted_bars=IndicatorCounted();

   cs = A_period + B_period + num_bars; //checksum used to see if parameters have been changed

   if ((cs==prevcs) && (commodt == Symbol()) &&
      (frame == (Time[4] - Time[5])) &&
      ((Bars - prevbars) < 2))
      startpar = Bars - prevbars;
   else
      startpar = -1;  //params haven't changed only need to calculate new bar

   commodt = Symbol();
   frame= Time[4] - Time[5];
   prevbars = Bars;
   prevcs = cs;

   if (startpar == 1 | startpar == 0)
      bar = startpar;
   else
      initDone = true;

   if (initDone) {
      //FastWoodieCCI[num_bars-1]=0;
      SlowWoodieCCI[num_bars-1]=0;
      HistoWoodieCCI[num_bars-1]=0;
      HistoBlue[num_bars-1]=0;
      HistoRed[num_bars-1]=0;
      bar=num_bars-2;
      initDone=false;
   }

   for (i = bar; i >= 0; i--) {
      //FastWoodieCCI[i]=iCCI(NULL,0,B_period,PRICE_TYPICAL,i);
      SlowWoodieCCI[i]=iCCI(NULL,0,A_period,PRICE_TYPICAL,i);

      now = iCCI(NULL,0,A_period,PRICE_TYPICAL,i);

      if ((prev >= 0 && now < 0) || (prev < 0 && now >= 0)) { // change of sign detected
         flag = true;
         count = 0;
      }

      if (flag) { // neutral territory
         if (thisbar != i)
            count++;
         prev = now;
         HistoWoodieCCI[i] = now;
         if (count >= neutral)
            flag = false;
         thisbar = i;
         continue;
      }

      // Colour it!
      if (now > 0)
      HistoBlue[i] = now;

      if (now < 0)
      HistoRed[i] = now;

      prev = now;

   }

   return(0);
  }
Comments