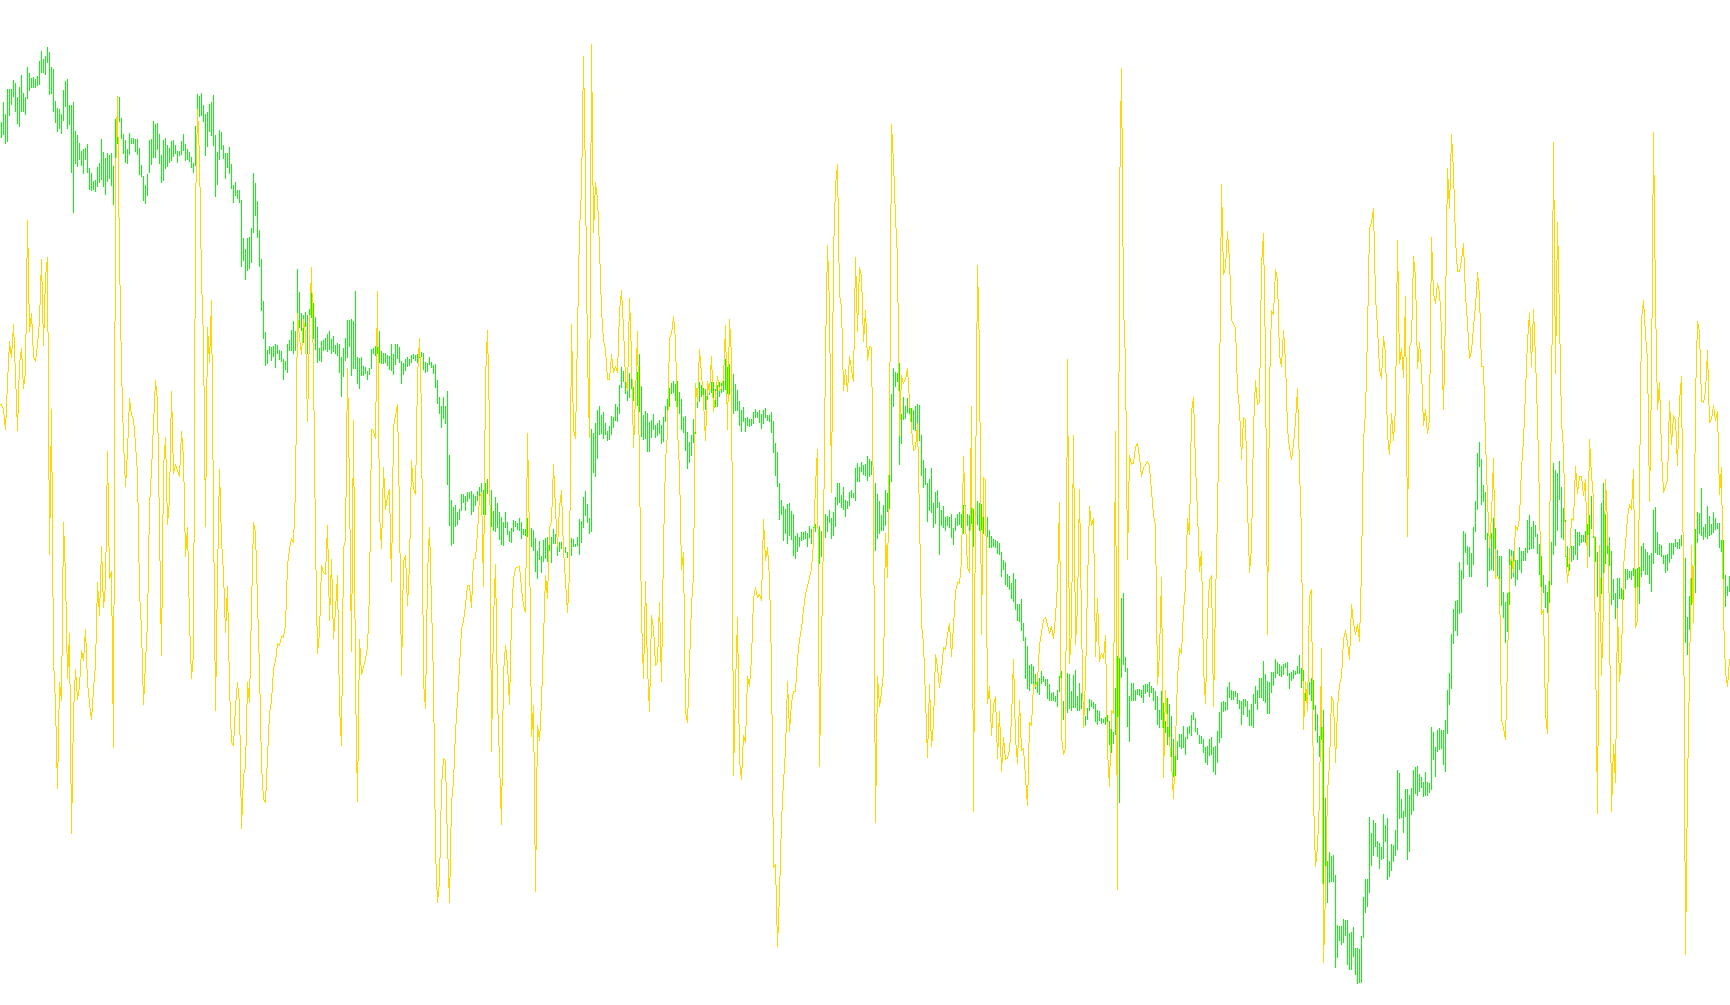
# Explanation of the Metatrader MQL Script Logic

The script provided is a technical analysis indicator called "Percentage Bollinger Bands" (%BB), which operates within the MetaTrader platform. It aims to give users an insight into market conditions by displaying how current prices relate to a range defined by Bollinger Bands.

## Key Components of the Indicator:

1. **Bollinger Bands**: These are bands that consist of a middle line (usually a simple moving average) and two outer lines. The width between these lines changes based on market volatility. In this script, parameters like `Bands_period` and `Bands_deviation` determine how these bands are calculated.

2. **Indicator Settings**:
   - **Separate Window**: This setting means the indicator will be displayed in its own window rather than overlaid on a chart.
   - **Buffer**: The indicator uses one buffer to store computed values, which is necessary for displaying data over time.
   - **Colors and Levels**: These settings determine how the lines are drawn (in red) and establish three horizontal levels at 0%, 50%, and 100% for reference.

3. **Customization Parameters**:
   - `Bands_period` (default: 20): This is the period of the moving average used to calculate the middle band.
   - `Bands_deviation` (default: 2): This defines how many standard deviations away from the moving average the upper and lower bands are drawn.

## How the Script Works:

### Initialization:
- The script begins by setting up its visual style and buffer. It configures the line style for drawing, sets which buffer will hold the data (`PercentBB`), assigns a label (%BB), and determines where to start drawing from on the chart (based on `Bands_period`).

### Deinitialization:
- This function is called when the indicator is removed or reset. Currently, it does not perform any actions.

### Iteration Process:
- The main logic of the script occurs in this phase. It calculates how far the current closing price is within the Bollinger Bands range as a percentage.
- **Steps**:
  - Determine how many bars have already been processed (`counted_bars`).
  - Iterate over each bar that hasn't been counted yet, starting from the earliest to the most recent.
  - For each bar, calculate the lower band (`LB`) and upper band (`UB`) using the `iBands` function with specified parameters like period and deviation.
  - Compute the percentage position of the current closing price within the Bollinger Bands using the formula:
    \[
    \text{PercentBB} = \left(\frac{\text{iClose} - LB}{UB - LB}\right) \times 100
    \]
  - This value is stored in the `PercentBB` buffer for each bar, representing how close the price is to the lower band (0%) or upper band (100%).

## Purpose:

The %BB indicator provides a straightforward way to assess whether the current market price is near the extremes of its recent volatility range. A percentage closer to 0% indicates that prices are near the lower band, suggesting potential bullish momentum, while a value near 100% suggests bearish conditions as prices approach the upper band.

This intuitive visualization helps traders make more informed decisions by offering a clear depiction of price behavior relative to historical volatility.
//+------------------------------------------------------------------+
//|                                                          %BB.mq4 |
//|                                    Copyright ? 2008, Walter Choy |
//|                                                                  |
//+------------------------------------------------------------------+
#property copyright "Copyright ? 2008, Walter Choy"
#property link      ""

#property indicator_separate_window
#property indicator_buffers 1
#property indicator_color1 Red
#property indicator_level1 0
#property indicator_level2 50
#property indicator_level3 100

extern int    Bands_period = 20;
extern double Bands_deviation = 2;

//---- buffers
double PercentBB[];
//+------------------------------------------------------------------+
//| Custom indicator initialization function                         |
//+------------------------------------------------------------------+
int init()
  {
//---- indicators
   SetIndexStyle(0, DRAW_LINE);
   SetIndexBuffer(0, PercentBB);
   SetIndexLabel(0, "%BB");
   SetIndexDrawBegin(0, Bands_period);
//----
   return(0);
  }
//+------------------------------------------------------------------+
//| Custom indicator deinitialization function                       |
//+------------------------------------------------------------------+
int deinit()
  {
//----

//----
   return(0);
  }
//+------------------------------------------------------------------+
//| Custom indicator iteration function                              |
//+------------------------------------------------------------------+
int start()
  {
   int    counted_bars = IndicatorCounted();
//----
   double LB, UB;
   int limit;

   if(counted_bars > 0) counted_bars--;
   limit = Bars - counted_bars - 1;

   for(int i = 0; i < limit; i++){
      LB = iBands(NULL, 0, Bands_period, Bands_deviation, 0, PRICE_CLOSE, MODE_LOWER, i);
      UB = iBands(NULL, 0, Bands_period, Bands_deviation, 0, PRICE_CLOSE, MODE_UPPER, i);

      PercentBB[i] = (iClose(NULL, 0, i) - LB)/(UB - LB) * 100;
   }
//----
   return(0);
  }
//+------------------------------------------------------------------+
Comments