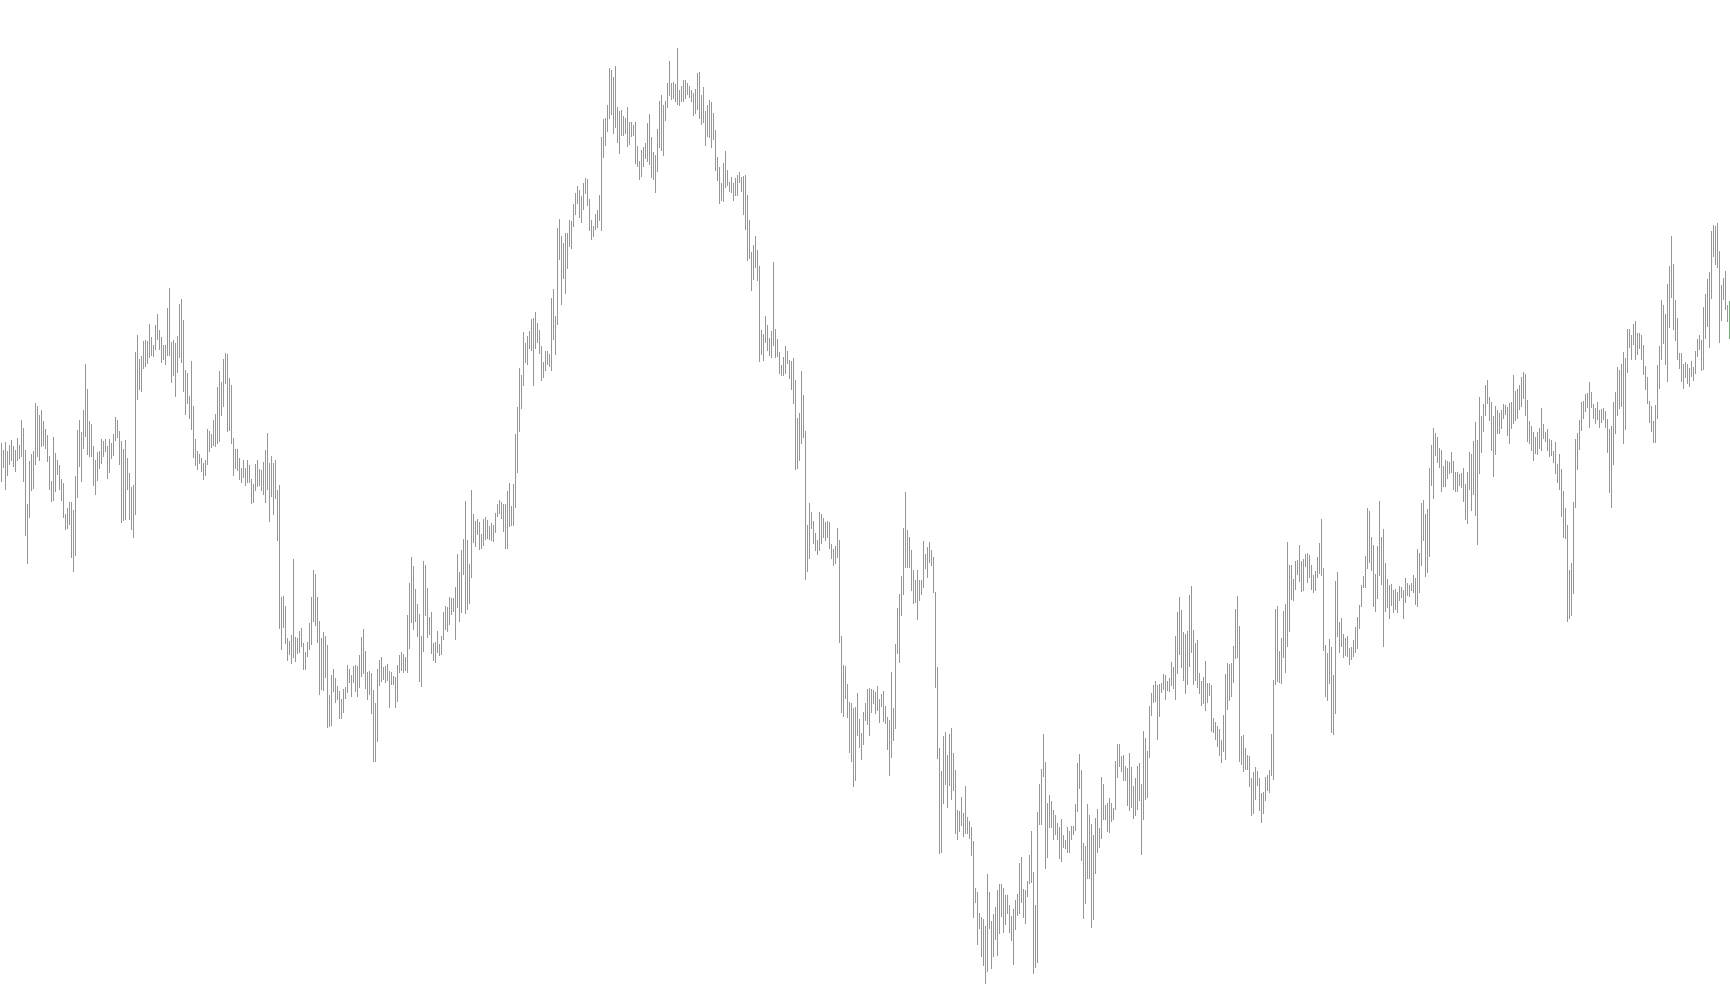
This tool is a custom technical analysis indicator designed to help traders visualize momentum and trend direction on a price chart. It functions by processing historical price data to generate a visual histogram that identifies whether the market is currently moving in an upward or downward direction.
How the Logic Works
The script operates through a three-step mathematical process:
1. Establishing the Base Performance First, the tool calculates two different "moving averages"—essentially smoothed versions of price data—over different timeframes (defined as "Short" and "Long"). By comparing these two, the script calculates the percentage difference between them. This allows the tool to measure how much the price is deviating from its long-term average relative to its short-term behavior.
2. Smoothing the Data To filter out minor market "noise" and prevent the indicator from reacting too aggressively to every tiny price flicker, the script applies an additional smoothing layer (the Mean AO). This step ensures that the resulting data points represent a more stable trend rather than temporary volatility.
3. Trend Identification and Visualization The final stage of the logic determines the direction of the trend by comparing the current smoothed value against the previous one:
- Upward Momentum: If the current value is higher than the previous value, the script identifies an upward trend and displays this as a positive green histogram.
- Downward Momentum: If the current value falls below the previous value, the script identifies a downward trend and displays this as a red histogram.
Key Features for the User
- Visual Clarity: Instead of just showing lines, the tool uses a histogram format, making it easy to see at a glance whether momentum is accelerating or decelerating.
- Safety Checks: The script includes built-in logic to ensure there is enough historical data present on the chart to perform accurate calculations before it begins displaying results.
- Customizable Sensitivity: Users can adjust the "Short," "Long," and "Mean" periods via the settings menu, allowing them to tailor the tool's sensitivity to different trading styles (e.g., making it faster for day trading or slower for long-term investing).
//+------------------------------------------------------------------+
//|                                                   AwesomeMod.mq4 |
//|                                                    Manel Sanchon |
//|                                                                  |
//+------------------------------------------------------------------+
#property copyright "Manel Sanchon"
#property link      ""
//---- indicator settings
#property  indicator_separate_window
#property  indicator_buffers 3
#property  indicator_color1  Green
#property  indicator_color2  Red

// External parameters
extern int short_mean = 5;
extern int long_mean = 34;
extern int meanAO = 7;


//---- indicator buffers
double UpBuffer[];
double DownBuffer[];
double ExtBuffer[];

//+------------------------------------------------------------------+
//| Custom indicator initialization function                         |
//+------------------------------------------------------------------+
int init()
  {
   //---- drawing settings
   SetIndexStyle(0,DRAW_HISTOGRAM);
   SetIndexStyle(1,DRAW_HISTOGRAM);
   SetIndexStyle(2,DRAW_NONE);
   IndicatorDigits(Digits+1);
   SetIndexDrawBegin(0,34);
   SetIndexDrawBegin(1,34);
   SetIndexDrawBegin(2,34);
//---- 3 indicator buffers mapping
   SetIndexBuffer(0,UpBuffer);
   SetIndexBuffer(1,DownBuffer);
   SetIndexBuffer(2,ExtBuffer);
//---- name for DataWindow and indicator subwindow label
   IndicatorShortName("AwesomeMod("+short_mean+","+long_mean+";"+meanAO+")");
   SetIndexLabel(0,"UpAO");
   SetIndexLabel(1,"DownAO");

//---- initialization done
   return(0);
  }
//+------------------------------------------------------------------+
//| Awesome Oscillator                                               |
//+------------------------------------------------------------------+
int start()
  {

  double ShortMA, LongMA;
  double MAExtBufferCurrent,MAExtBufferPrev;
  int Count;

  if(Bars<=long_mean)
    {
      Comment("Not enough bars to make computations");
      return(0);
    }

  if(meanAO>long_mean)
    {
      Comment("Mean AO has to be smaller than Long mean");
      return(0);
    }

  int counted_bars = IndicatorCounted();
  int CalculateBars = Bars-counted_bars-(long_mean+1);
  if(counted_bars>long_mean)
     {
      CalculateBars=Bars-counted_bars-1;
     }


//--- handles for MAs
  for(Count = CalculateBars; Count >=0 ; Count--)
   {
     ShortMA = iMA(NULL,0,short_mean,0,MODE_SMMA,PRICE_MEDIAN,Count);
     LongMA = iMA(NULL,0,long_mean,0,MODE_SMMA,PRICE_MEDIAN,Count);
     ExtBuffer[Count] = (ShortMA/LongMA-1)*100;
   }

//---- dispatch values between 2 buffers
   bool up=true;
   for(Count = CalculateBars; Count >= 0; Count--)
     {
        MAExtBufferCurrent = iMAOnArray(ExtBuffer,0,meanAO,0,MODE_SMMA,Count);
        MAExtBufferPrev = iMAOnArray(ExtBuffer,0,meanAO,0,MODE_SMMA,Count+1);
        if(MAExtBufferCurrent>MAExtBufferPrev) up=true;
      if(MAExtBufferCurrent<MAExtBufferPrev) up=false;
      if(!up)
        {
         UpBuffer[Count]=0.0;
         DownBuffer[Count]=MAExtBufferCurrent;
        }
      else
        {
         DownBuffer[Count]=0.0;
         UpBuffer[Count]=MAExtBufferCurrent;
        }
     }
//---- done
   return(0);
  }
//+------------------------------------------------------------------+
Comments