AnotherInstr1
Download script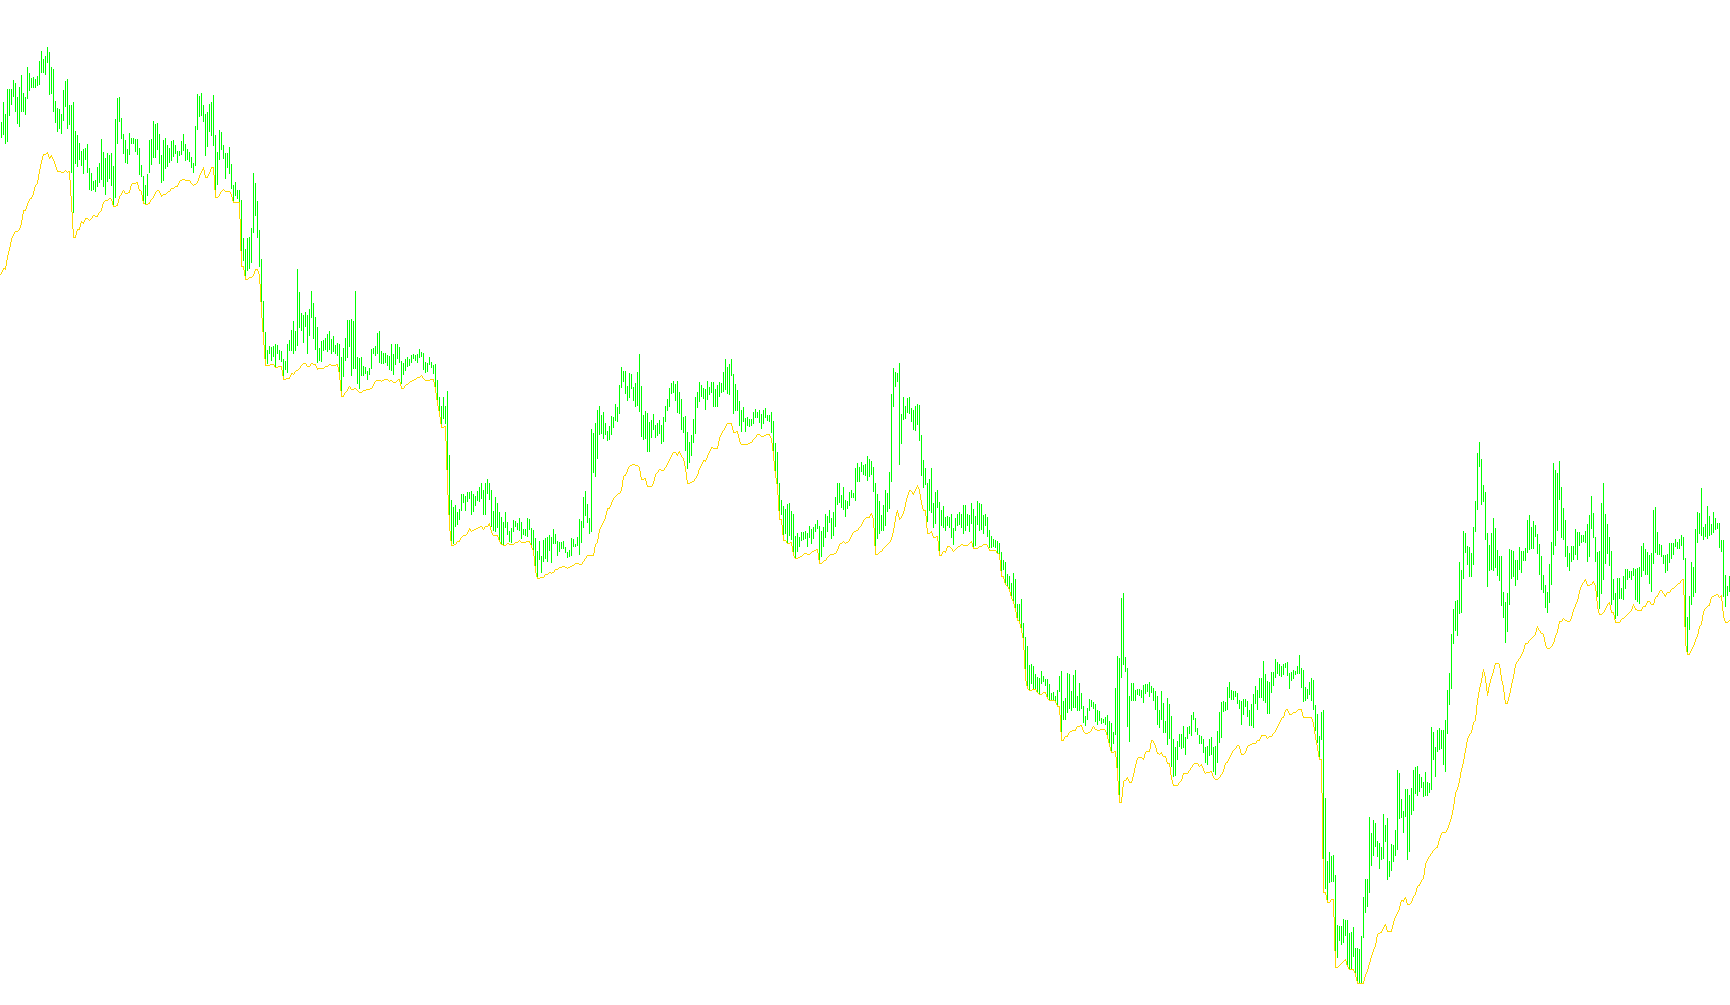
This tool is designed to provide a visual trend line on your trading chart by analyzing the relationship between two different financial instruments. Instead of looking at just one pair, it calculates a "synthetic" price point based on how a secondary currency pair behaves relative to its own price range.
How the Logic Works
1. Dual Instrument Comparison The script looks at two different assets simultaneously. While you are viewing your primary chart (for example, EURUSD), the tool silently monitors a second instrument that you specify in the settings (such as GBPUSD).
2. Relative Positioning For every candle on your current chart, the script determines where the price of the second instrument sits within its recent high-to-low range. It calculates a percentage based on whether that price is closer to the top or the bottom of its recent movement.
3. Weighted Projection The tool then takes that relative "position" from the second instrument and applies it to the price range of your current chart. Essentially, it asks: "If the second currency pair is currently trading at 70% of its range, where would that same 70% mark land on my current chart?"
4. Multi-Step Smoothing To ensure the resulting line isn't jagged or erratic, the script doesn't just do this calculation once. It repeats the process multiple times using expanding windows (looking at the last few candles, then the last 4, then the last 8, and so on). It averages all these different perspectives together to create a single, smoothed output line.
5. Mirroring Option The logic includes a "mirror" toggle. When turned off, the script projects the price based on the low end of the range; when turned on, it flips the calculation to project from the high end. This allows you to adjust how the secondary instrument's influence is mapped onto your primary chart.
Summary of Use
The final result is a red line plotted on your chart. This line represents a mathematical "translation" of one currency pair's behavior onto another, filtered through a smoothing process to help identify price trends or potential correlation points between two different markets.
#property indicator_chart_window
#property indicator_buffers 1
#property indicator_color1 Red
//---- input parameters
extern string     Instr="GBPUSD";
extern int        multistep=6;
extern bool       mirror=false;

double OUT[];

int init()
  {
//---- indicators
   IndicatorShortName("AnotherInstr "+Instr);
   SetIndexStyle(0,DRAW_LINE);
   SetIndexBuffer(0,OUT);
//----
   return(0);
  }
int deinit()
  {
   return(0);
  }
int start()
  {
     int limit;
     int counted_bars=IndicatorCounted();
     limit=Bars-counted_bars;
     for(int i=0; i<limit; i++){
       int period=2;
       double MA=0;
       for (int j=1;j<=multistep;j++){
         double anotherHi=iHigh(Instr,0,iHighest(Instr,0,MODE_HIGH,period,iBarShift(Instr,0,Time[i])));
         double anotherLo=iLow(Instr,0,iLowest(Instr,0,MODE_LOW,period,iBarShift(Instr,0,Time[i])));
         double anotherCl=iClose(Instr,0,iBarShift(Instr,0,Time[i]));
         double anotherWidth=(anotherHi-anotherLo);
         double Hi=iHigh(NULL,0,iHighest(NULL,0,MODE_HIGH,period,i));
         double Lo=iLow(NULL,0,iLowest(NULL,0,MODE_LOW,period,i));
         double Cl=iClose(NULL,0,i);
         double Width=(Hi-Lo);

         if (anotherWidth>0) double pos=(anotherCl-anotherLo)/anotherWidth; else pos=0;
         if (mirror) MA=MA+(Hi-pos*Width); else MA=MA+(Lo+pos*Width);
         period=period*2;
       }//for
       OUT[i]=MA/multistep;
     }//for
   return(0);
  }
Comments