ADX_Crossy_v1
Download script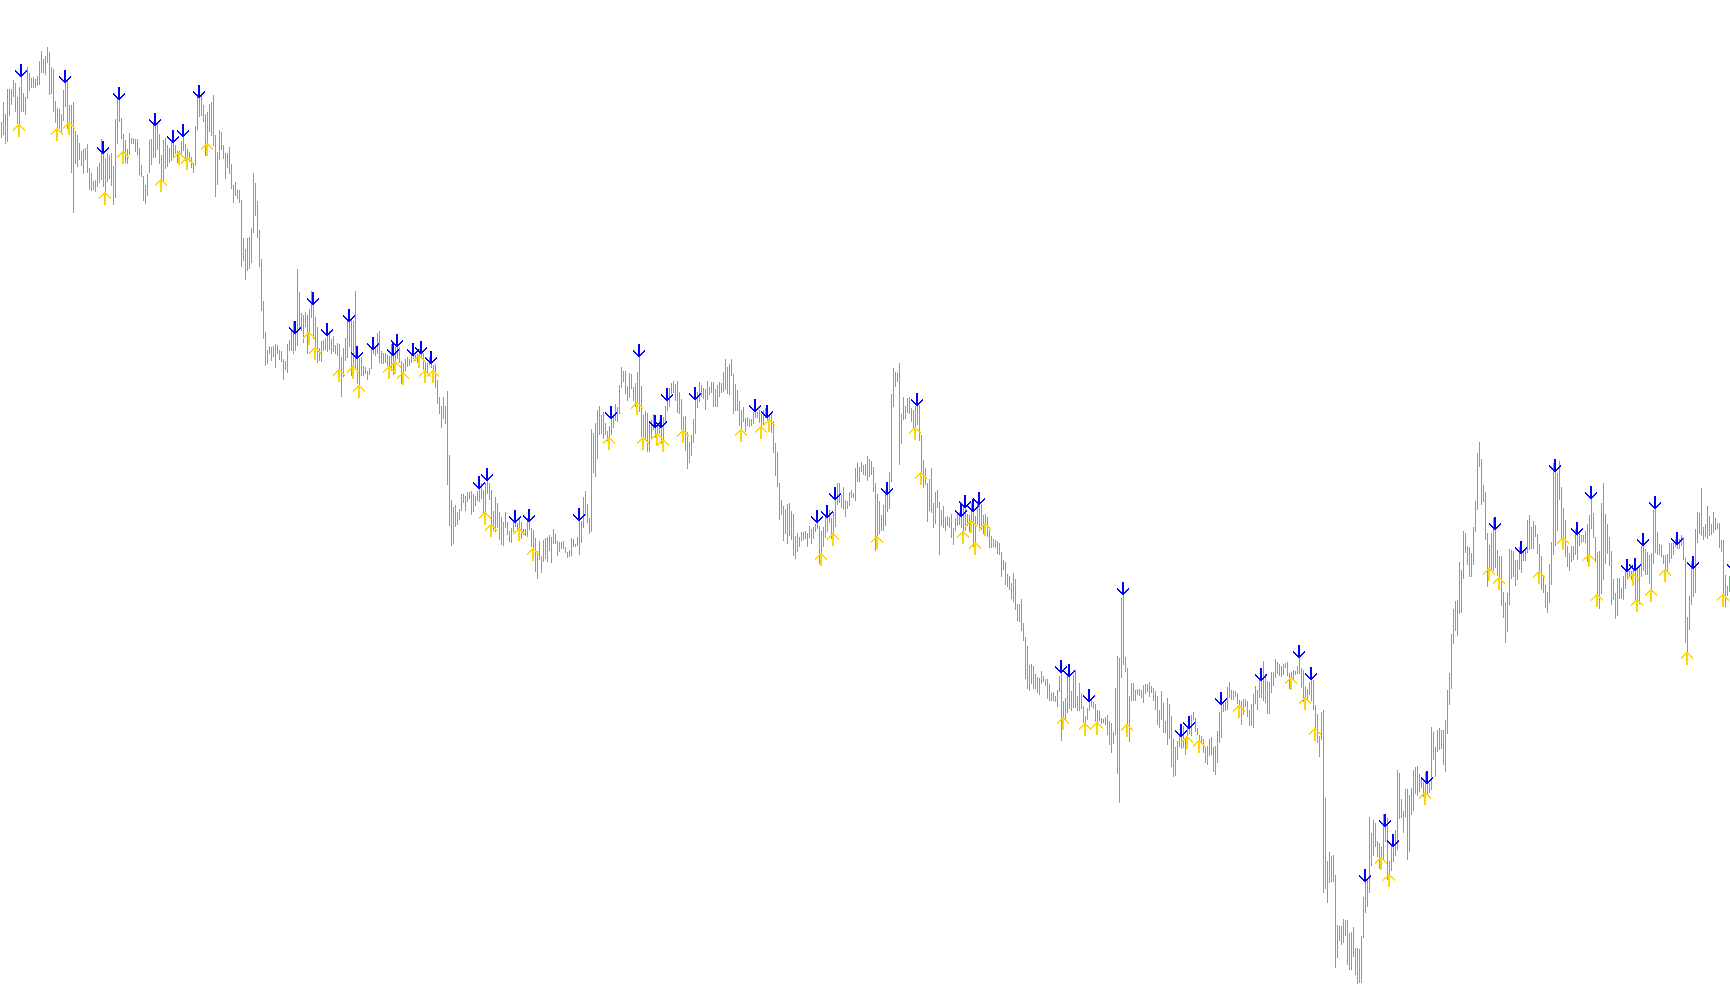
This technical indicator is designed to identify specific momentum shifts in the financial markets by monitoring the relationship between two primary trend-strength components: the Plus Directional Indicator (+DI) and the Minus Directional Indicator (-DI).
Core Logic and Functionality
The tool operates by scanning historical price data to detect "crosses"—moments where the prevailing strength of the market flips from one direction to another. It focuses on the following mechanics:
- Trend Momentum Tracking: The script constantly calculates the strength of upward price movement (+DI) versus downward price movement (-DI) over a user-defined period.
- Crossover Identification:
- Bearish Signal: When the upward momentum was previously higher than the downward momentum but has since dropped below it, the tool identifies a potential shift toward a downtrend.
- Bullish Signal: Conversely, when the downward momentum was previously higher but is now surpassed by the upward momentum, the tool identifies a potential shift toward an uptrend.
- Visual Alerts: Instead of just providing raw data, the script places visual markers (arrows) directly on your trading chart. These appear at specific price points to highlight exactly where these momentum flips occurred.
Dynamic Adjustments
To ensure the indicator remains readable and useful across different types of charts, it features an intelligent scaling system:
- Automated Spacing: The script automatically detects which timeframe you are viewing (e.g., 1-minute, 1-hour, or Daily charts). It then adjusts the vertical distance of the signal arrows based on that timeframe. This prevents markers from overlapping with price candles on fast-moving charts while ensuring they remain clearly visible on slower, high-timeframe charts.
- Customizable Sensitivity: Users can modify the "Period" setting to determine how much historical data the indicator should consider when calculating trend strength, allowing for a balance between reacting quickly to new moves and filtering out market "noise."
In summary, this tool serves as a visual navigation system that highlights transition points in market momentum, helping traders identify where one trend's strength is yielding to another.
/*-----------------------------+
|			       |
| Shared by www.Aptrafx.com    |
|			       |
+------------------------------*/

//+------------------------------------------------------------------+
//|                      Copyright © 2004, MetaQuotes Software Corp. |
//|                                       http://www.metaquotes.net/ |
//+------------------------------------------------------------------+

#property copyright "Copyright © 2004, MetaQuotes Software Corp."
#property link "http://www.metaquotes.net"
#property indicator_chart_window
#property indicator_buffers 2
#property indicator_color1 Lime
#property indicator_color2 Red
extern int ADXcrossesPeriod = 14;
extern int SignalBar=1;
extern int CountBars=350;
double ExtMapBuffer1[];
double ExtMapBuffer2[];
double b4plusdi, b4minusdi, nowplusdi, nowminusdi;
int    nShift;

//+------------------------------------------------------------------+
//| Custom indicator initialization function                         |
//+------------------------------------------------------------------+

int init()
  {

    SetIndexStyle(0, DRAW_ARROW, 0, 1);
    SetIndexArrow(0, 225);
    SetIndexBuffer(0, ExtMapBuffer1);

    SetIndexStyle(1, DRAW_ARROW, 0, 1);
    SetIndexArrow(1, 226);
    SetIndexBuffer(1, ExtMapBuffer2);

    IndicatorShortName("ADXcrosses(" + ADXcrossesPeriod + ")");
    SetIndexLabel(0, "ADXcrUp");
    SetIndexLabel(1, "ADXcrDn");

    switch(Period())
      {
        case     1: nShift = 1;   break;
        case     5: nShift = 3;   break;
        case    15: nShift = 5;   break;
        case    30: nShift = 10;  break;
        case    60: nShift = 15;  break;
        case   240: nShift = 20;  break;
        case  1440: nShift = 80;  break;
        case 10080: nShift = 100; break;
        case 43200: nShift = 200; break;
      }

    return(0);
  }

//+------------------------------------------------------------------+
//| Custor indicator deinitialization function                       |
//+------------------------------------------------------------------+

int deinit()
  {

    return(0);
  }

//+------------------------------------------------------------------+
//| Custom indicator iteration function                              |
//+------------------------------------------------------------------+

int start()
  {
    int limit;
    int counted_bars = IndicatorCounted();

    if(counted_bars < 0)
        return(-1);

    if(counted_bars > 0)
        counted_bars--;
    limit = Bars - counted_bars;

    for(int i = 0; i < limit; i++)
      {
        b4plusdi = iADX(NULL, 0, ADXcrossesPeriod, PRICE_CLOSE,   MODE_PLUSDI,  i+SignalBar+1 );
        nowplusdi = iADX(NULL, 0, ADXcrossesPeriod, PRICE_CLOSE,  MODE_PLUSDI,  i+SignalBar);
        b4minusdi = iADX(NULL, 0, ADXcrossesPeriod, PRICE_CLOSE,  MODE_MINUSDI, i+SignalBar+1);
        nowminusdi = iADX(NULL, 0, ADXcrossesPeriod, PRICE_CLOSE, MODE_MINUSDI, i+SignalBar);

        if(b4plusdi > b4minusdi && nowplusdi < nowminusdi)
            ExtMapBuffer1[i] = Low[i] - nShift*Point;

        if(b4plusdi < b4minusdi && nowplusdi > nowminusdi)
            ExtMapBuffer2[i] = High[i] + nShift*Point;
      }

    return(0);
  }
Comments