ADX_coloured
Download script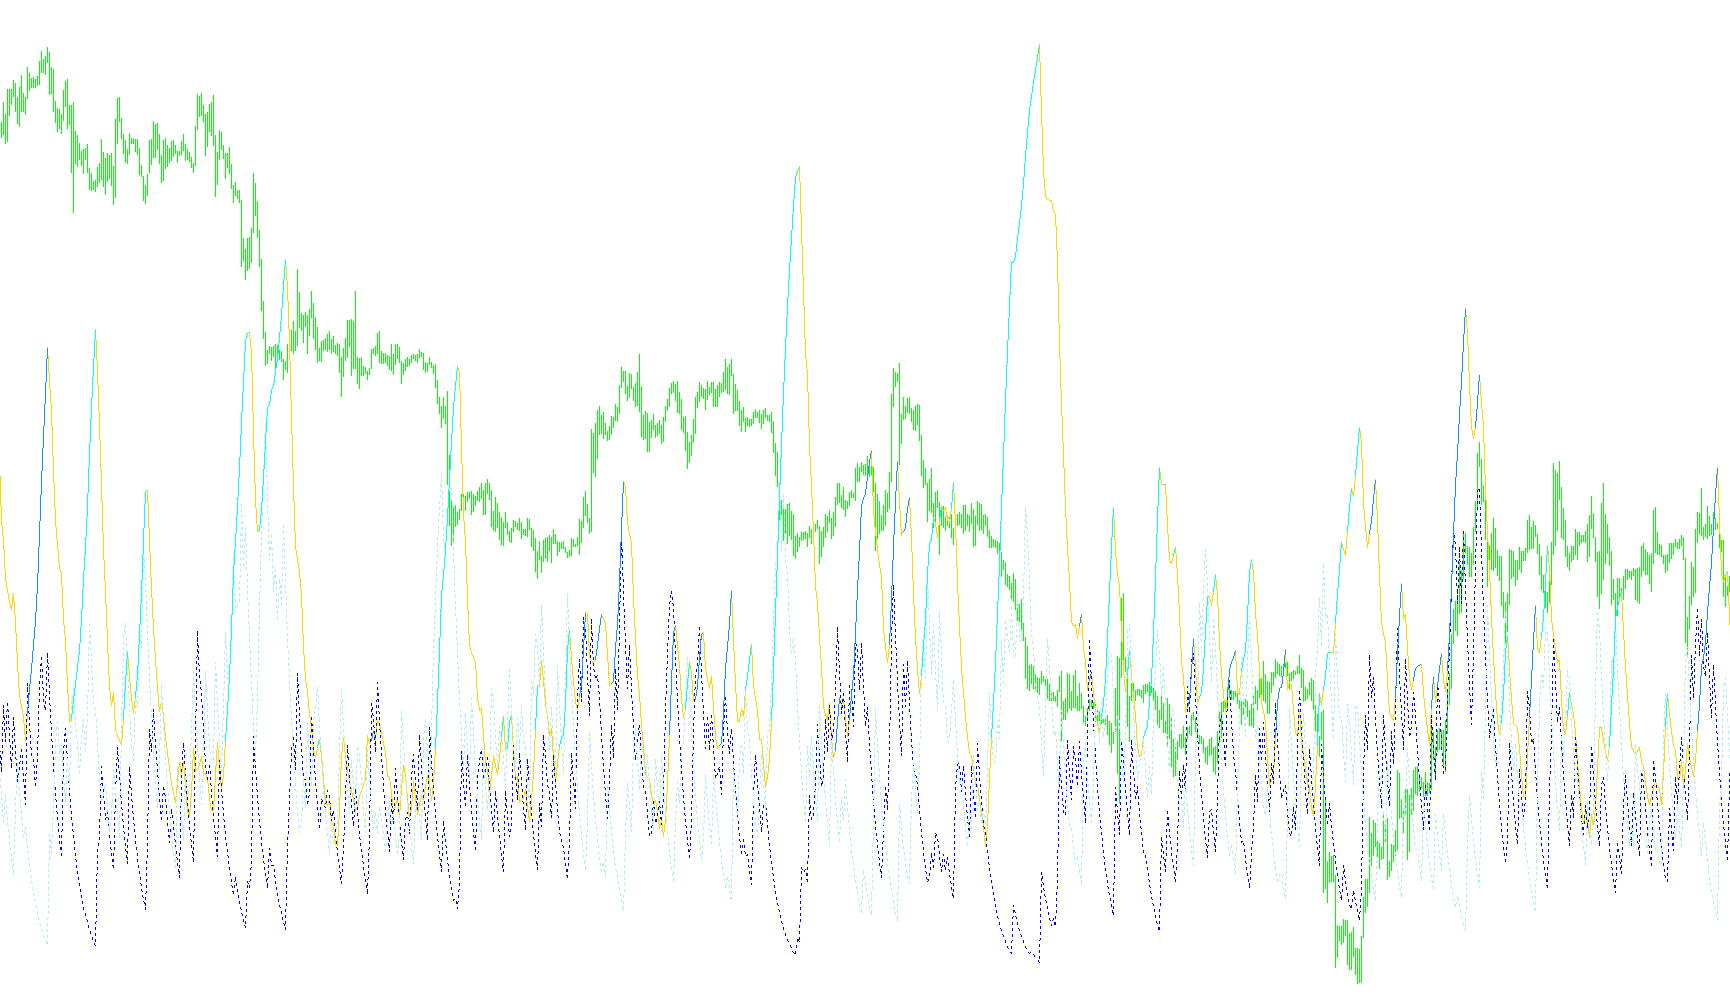
The ADX Coloured indicator is a specialized technical analysis tool designed to help traders visualize market strength and the direction of price movements more clearly. While it is based on the standard Average Directional Index (ADX), this specific version adds a visual color-coding system to distinguish between different market conditions at a glance.
How the Logic Works
The script analyzes the market using three primary components: the main ADX line (which measures the overall strength of a trend), the Plus DI (positive direction indicator), and the Minus DI (negative direction indicator).
Instead of just showing these lines as static data, the script processes the information through the following logic:
- Trend Strength Check: The tool monitors whether the ADX is currently rising. If the value is increasing compared to its previous position, it indicates that a trend is gaining momentum.
- The "Activity" Threshold: The indicator uses a specific user-defined level (defaulting to 20). This acts as a filter; the script only considers the market to be in a "strong" enough trend to colorize once the ADX value exceeds this number.
- Directional Identification: When the strength is high enough, the script compares the Plus DI and Minus DI to determine which way the price is moving:
- Upward Trend: If the market is showing strength and the Positive DI is higher than the Negative DI, the indicator highlights the trend in Lime.
- Downward Trend: If the market is showing strength but the Negative DI is higher than the Positive DI, the indicator highlights the trend in Red.
- Neutral/Transition Phase: If the market does not meet the strength threshold, or if it is moving sideways without a clear direction, the indicator displays the data in a neutral color.
Summary for the User
Essentially, this tool simplifies your charting experience by doing the "heavy lifting" of comparison. Instead of you having to manually look at three different lines and calculate which is higher or stronger, the script automatically identifies when a trend is significant and changes the visual output to show you clearly whether that momentum is Bullish (Up) or Bearish (Down).
//+------------------------------------------------------------------+
//|                                                 ADX_coloured.mq4 |
//|                                                   Piotr Lisowski |
//|                                          piotr.lisowski@achem.pl |
//+------------------------------------------------------------------+
#property copyright "Copyright © 2004, MetaQuotes Software Corp."
#property link      "http://www.metaquotes.net/"

#property indicator_separate_window
#property indicator_buffers 5
#property indicator_color1 LightSeaGreen // neutral
#property indicator_color2 YellowGreen
#property indicator_color3 Wheat
#property indicator_color4 Lime /// UP
#property indicator_color5 Red // DOWN
//---- input parameters
extern int ADXPeriod=14;
extern int colour_level=20;
//---- buffers
double ADXBuffer[];
double ADXUpBuffer[];
double ADXDownBuffer[];
double PlusDiBuffer[];
double MinusDiBuffer[];
//+------------------------------------------------------------------+
//| Custom indicator initialization function                         |
//+------------------------------------------------------------------+
int init()
  {
//---- 3 additional buffers are used for counting.
   IndicatorBuffers(5);
//---- indicator buffers
   SetIndexBuffer(0,ADXBuffer);
   SetIndexBuffer(1,PlusDiBuffer);
   SetIndexBuffer(2,MinusDiBuffer);
   SetIndexBuffer(3,ADXUpBuffer);
   SetIndexBuffer(4,ADXDownBuffer);

//---- name for DataWindow and indicator subwindow label
   IndicatorShortName("ADX("+ADXPeriod+")");
   SetIndexLabel(0,"ADX");
   SetIndexLabel(1,"+DI");
   SetIndexLabel(2,"-DI");
   SetIndexLabel(3,"ADXUp");
   SetIndexLabel(4,"ADXDown");
//----
   SetIndexDrawBegin(0,ADXPeriod);
   SetIndexDrawBegin(1,ADXPeriod);
   SetIndexDrawBegin(2,ADXPeriod);
   SetIndexDrawBegin(3,ADXPeriod);
   SetIndexDrawBegin(4,ADXPeriod);
   SetIndexStyle(1, DRAW_LINE, STYLE_DOT);
   SetIndexStyle(2, DRAW_LINE, STYLE_DOT);

//----
   return(0);
  }
//+------------------------------------------------------------------+
//| Average Directional Movement Index                               |
//+------------------------------------------------------------------+
int start()
  {

//----
    int limit;
   int counted_bars=IndicatorCounted();
   if(counted_bars<0) counted_bars=0;
   if(counted_bars>0) counted_bars--;
   limit=Bars-counted_bars;

   double adx_0,adx_1,dmip_0,dmip_1,dmim_0,dmim_1;

   for(int i = 0 ;i < limit ;i++)
   {


      adx_0 = iADX(NULL,0,ADXPeriod,PRICE_CLOSE,0,i);
      adx_1 = iADX(NULL,0,ADXPeriod,PRICE_CLOSE,0,i+1);

      dmip_0 = iADX(NULL,0,ADXPeriod,PRICE_CLOSE,1,i);
      dmip_1 = iADX(NULL,0,ADXPeriod,PRICE_CLOSE,1,i+1);

      dmim_0 = iADX(NULL,0,ADXPeriod,PRICE_CLOSE,2,i);
      dmim_1 = iADX(NULL,0,ADXPeriod,PRICE_CLOSE,2,i+1);


      if(adx_0>adx_1&&dmip_0>dmim_0&&adx_0>=colour_level)
      {//up
         ADXBuffer[i] = EMPTY_VALUE;
         ADXUpBuffer[i] = adx_0;
         ADXDownBuffer[i] = EMPTY_VALUE;
      }
      else if(adx_0>adx_1&&dmip_0<dmim_0&&adx_0>=colour_level)
      {//down
         ADXBuffer[i] = EMPTY_VALUE;
         ADXUpBuffer[i] = EMPTY_VALUE;
         ADXDownBuffer[i] = adx_0;
      }
      else
      {
         ADXBuffer[i] = adx_0;
         ADXUpBuffer[i] = EMPTY_VALUE;
         ADXDownBuffer[i] = EMPTY_VALUE;
      }
         ADXBuffer[i] = adx_0;
         PlusDiBuffer[i] = dmip_0;
         MinusDiBuffer[i] = dmim_0;
   }
//----


   return(0);
  }
//+------------------------------------------------------------------+
Comments