3MA02IND
Download script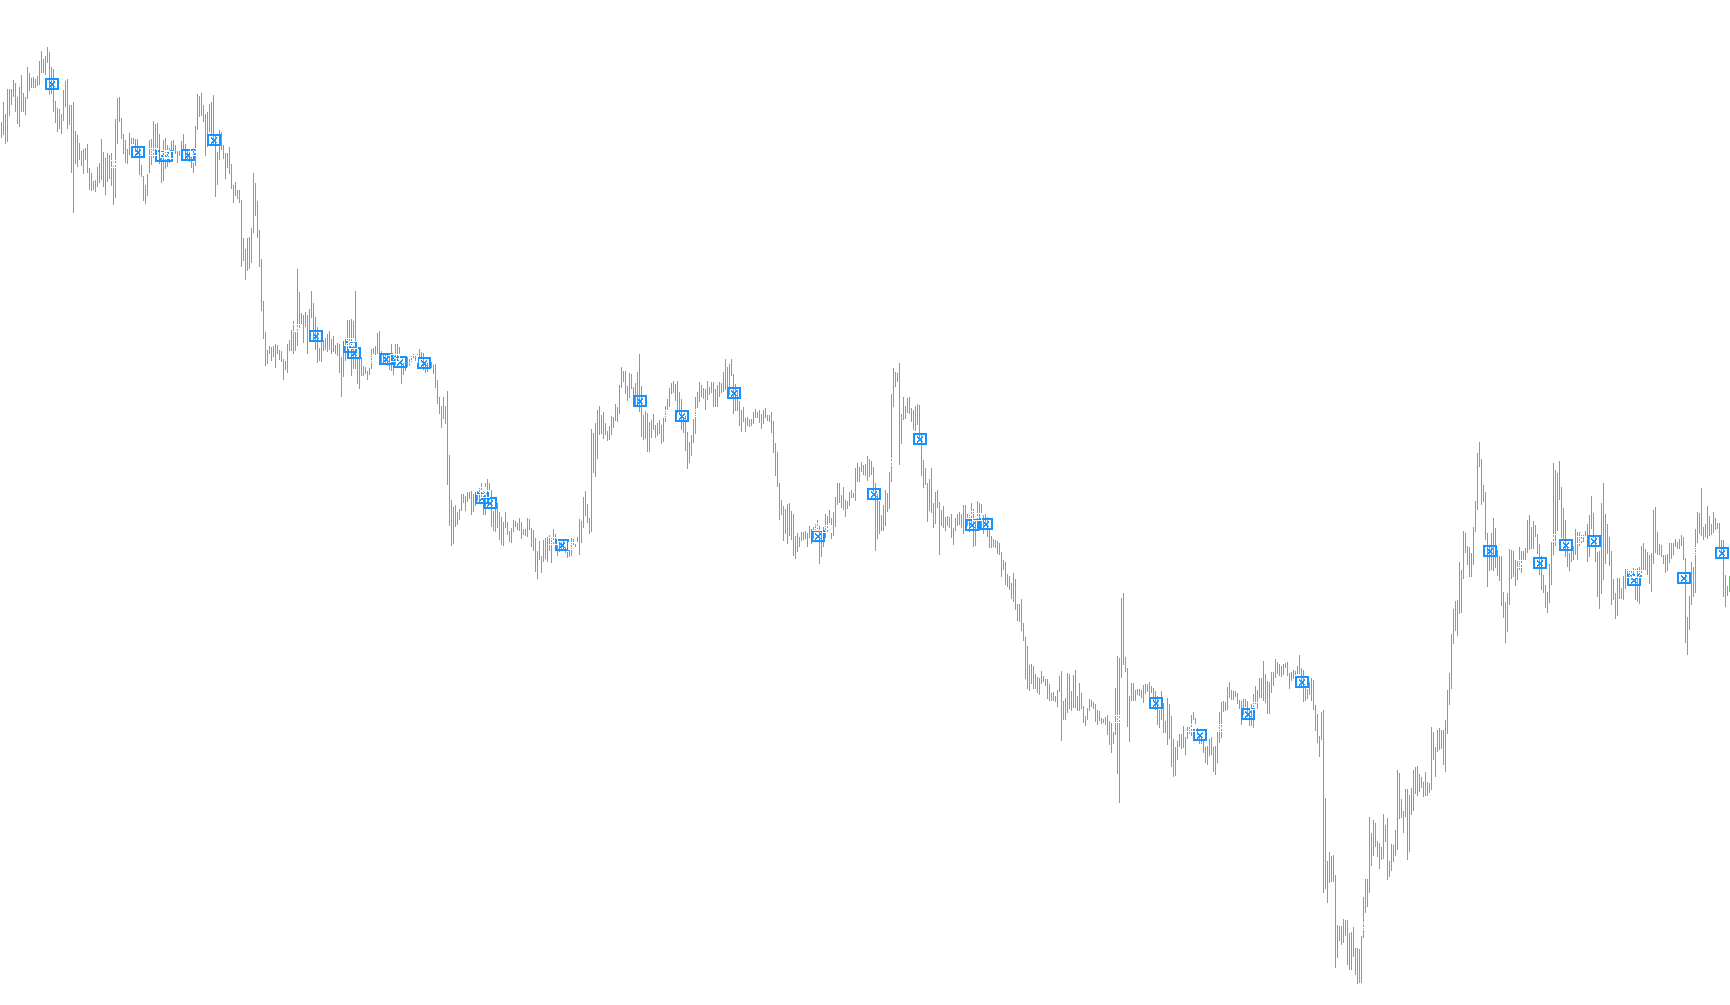
This tool is designed as a visual aid for traders to identify specific momentum shifts and trend changes on a price chart. It simplifies complex technical analysis into clear, actionable visual markers by monitoring the relationship between two different moving averages.
Core Logic Overview
The script functions by constantly comparing two "Moving Averages" (MAs) of different lengths:
- Fast Average: A short-term average (5 periods) that reacts quickly to recent price changes.
- Slow Average: A longer-term average (25 periods) that represents the broader market trend.
The primary goal of the logic is to detect "crossovers"—the specific moments when the short-term momentum shifts from being below the long-term trend to above it, or vice versa.
How it Works
The script scans historical price data and looks for two specific mathematical events:
-
Bullish Momentum (Rising): When the Fast Average moves from a position below the Slow Average to a position above it, the script identifies this as a potential upward shift in momentum. It marks this point on your chart to signal that price strength may be increasing.
-
Bearish Momentum (Falling): Conversely, when the Fast Average moves from a position above the Slow Average to a position below it, the script identifies this as a potential downward shift in momentum. It marks these points to signal that price strength may be weakening.
Visual Output
Instead of forcing you to manually calculate where these averages meet, the script automatically places specific symbols (arrows and boxes) directly on the chart at the exact moment these crossovers occur. This allows you to see historical trend changes at a glance and helps in identifying potential entry or exit points based on moving average dynamics.
//+------------------------------------------------------------------+
//| 5 Min RSI 12-period qual INDICATOR                               |
//+------------------------------------------------------------------+
#property copyright "Ron T"
#property link      "http://www.lightpatch.com"

#property indicator_chart_window
#property indicator_buffers 8

#property indicator_color1 Red
#property indicator_color2 HotPink
#property indicator_color3 DarkGray
#property indicator_color4 Red

#property indicator_color5 White
#property indicator_color6 LightGray
#property indicator_color7 DarkGray
#property indicator_color8 White


//---- buffers
double Buffer1[];
double Buffer2[];
double Buffer3[];
double Buffer4[];
double Buffer5[];
double Buffer6[];
double Buffer7[];
double Buffer8[];


// User Input


//+------------------------------------------------------------------+
//| Custom indicator initialization function                         |
//|------------------------------------------------------------------|

int init()
  {

   // 233 up arrow
   // 234 down arrow
   // 159 big dot
   // 158 little dot
   // 168 open square
   // 120 box with X

   SetIndexStyle(0,DRAW_ARROW);
   SetIndexBuffer(0, Buffer1);
   SetIndexArrow(0,159);  //up

   SetIndexStyle(1,DRAW_ARROW);
   SetIndexBuffer(1, Buffer2);
   SetIndexArrow(1,159);  //down

   SetIndexStyle(2,DRAW_ARROW);
   SetIndexBuffer(2, Buffer3);
   SetIndexArrow(2,112);

   SetIndexStyle(3,DRAW_ARROW);
   SetIndexBuffer(3, Buffer4);
   SetIndexArrow(3,120);

   SetIndexStyle(4,DRAW_ARROW);
   SetIndexBuffer(4, Buffer5);
   SetIndexArrow(4,159);

   SetIndexStyle(5,DRAW_ARROW);
   SetIndexBuffer(5, Buffer6);
   SetIndexArrow(5,159);

   SetIndexStyle(6,DRAW_ARROW);
   SetIndexBuffer(6, Buffer7);
   SetIndexArrow(6,112);

   SetIndexStyle(7,DRAW_ARROW);
   SetIndexBuffer(7, Buffer8);
   SetIndexArrow(7,120);

   return(0);
  }


//+------------------------------------------------------------------+
//| Custor indicator deinitialization function                       |
//+------------------------------------------------------------------+
int deinit()
  {
   int i;

   for( i=0; i<Bars; i++ ) Buffer1[i]=0;
   for( i=0; i<Bars; i++ ) Buffer2[i]=0;
   for( i=0; i<Bars; i++ ) Buffer3[i]=0;
   for( i=0; i<Bars; i++ ) Buffer4[i]=0;
   for( i=0; i<Bars; i++ ) Buffer5[i]=0;
   for( i=0; i<Bars; i++ ) Buffer6[i]=0;
   for( i=0; i<Bars; i++ ) Buffer7[i]=0;
   for( i=0; i<Bars; i++ ) Buffer8[i]=0;

   return(0);
  }


//+------------------------------------------------------------------+
//| Custom indicator iteration function                              |
//+------------------------------------------------------------------+

// Current position if 55/45 or over/under. Does any of
// the previous 'qual' period ever fall below55/above45? (last11)
//
// If qual*2 periods have been above55/below45
// then lets not try to transact any more (last22)


int start()
  {
   int      pos=Bars-100; // leave room for moving average periods

   double   cMAfst=0, pMAfst=0;
   double   cMAslo=0, pMAslo=0;
   double   MA100=0;

   double p=Point();

   while(pos>=1)
     {

      cMAfst=iMA(Symbol(),0,5,0,MODE_LWMA,PRICE_CLOSE, pos);
      pMAfst=iMA(Symbol(),0,5,0,MODE_LWMA,PRICE_CLOSE, pos+1);

      cMAslo=iMA(Symbol(),0,25,0,MODE_LWMA,PRICE_CLOSE, pos);
      pMAslo=iMA(Symbol(),0,25,0,MODE_LWMA,PRICE_CLOSE, pos+1);

      // rising
      if (pMAfst<=pMAslo && cMAfst>=cMAslo)
        {
         Buffer8[pos]=cMAfst;
        }

      //falling
      if (pMAfst>=pMAslo && cMAfst<=cMAslo)
        {
         Buffer4[pos]=cMAfst;
        }

 	   pos--;
     }

   return(0);
  }
//+------------------------------------------------------------------+
Comments