0_MoR2a
Download script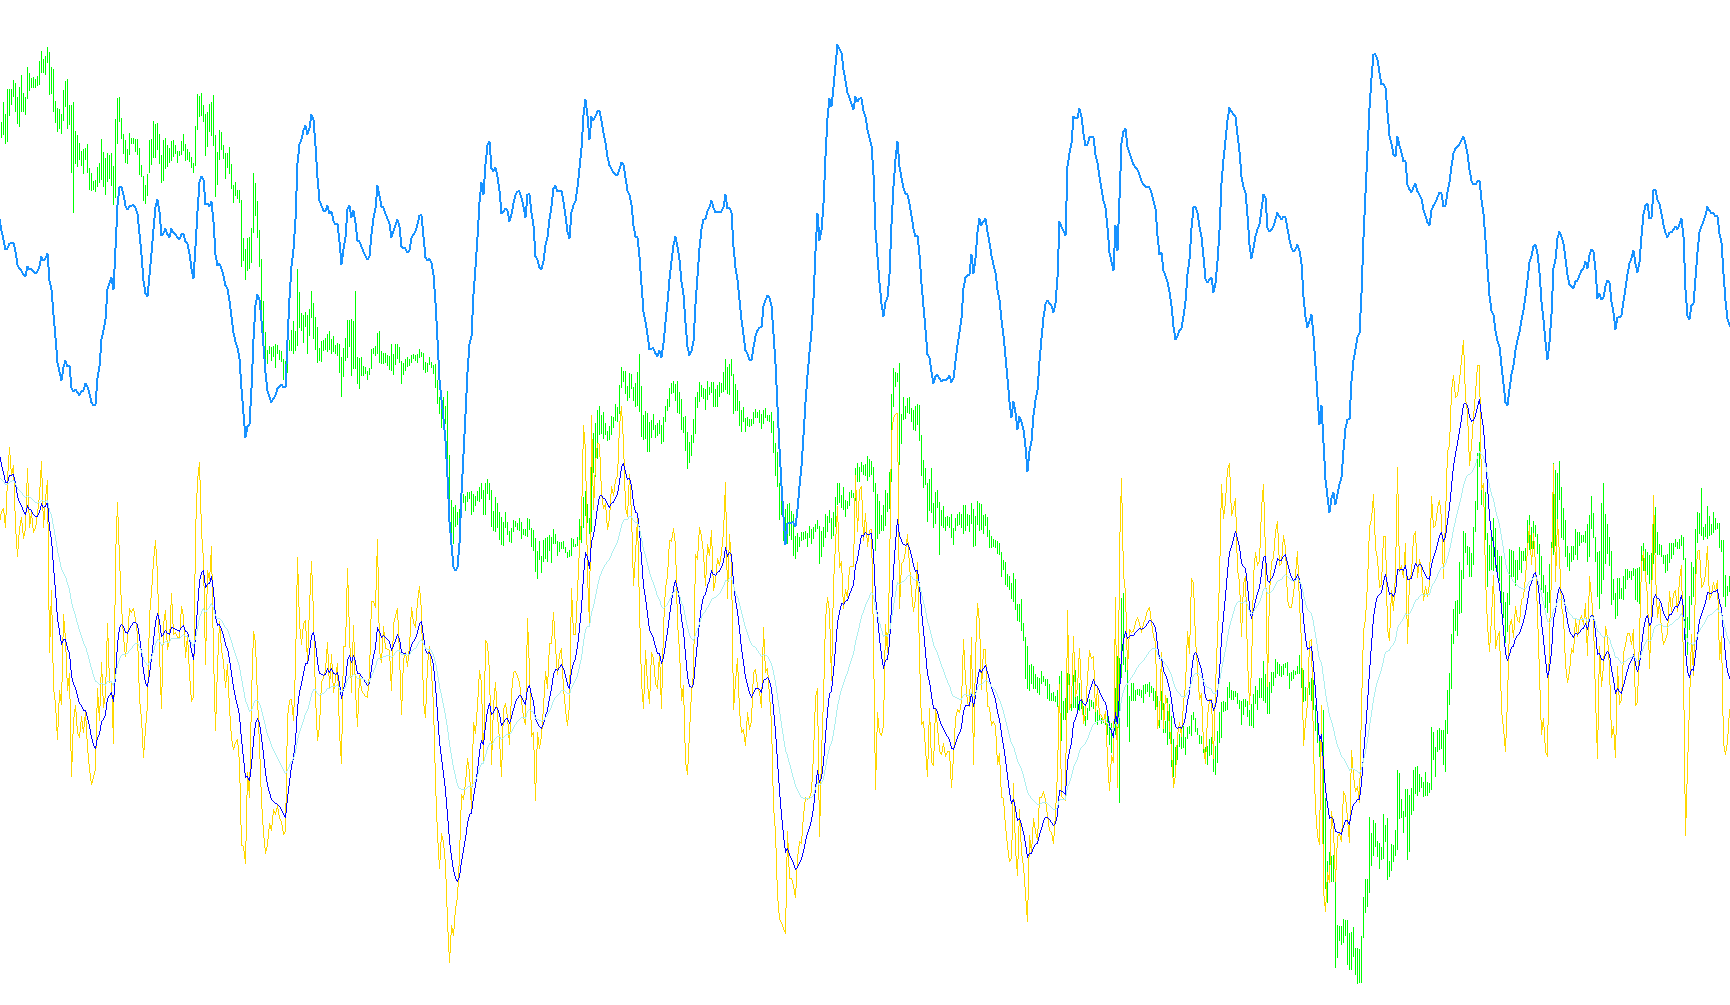
This tool is designed to provide traders with a multi-layered visual analysis of market momentum and trend strength. Rather than looking at price action alone, it processes several layers of data to create a specialized mathematical output that helps identify potential shifts in market behavior.
How the Logic Works
The indicator operates through a three-step calculation process:
1. Momentum Baseline (RSI) The core foundation of this tool is the Relative Strength Index (RSI). This measures the speed and change of price movements. By using this as the primary data source, the tool focuses on "momentum" rather than just raw price, helping to filter out some of the market noise.
2. Moving Average Smoothing Instead of applying traditional moving averages directly to the price (like candles), this script applies two different types of Exponential Moving Averages (EMA) specifically to the RSI data.
- Short-term Smoothing: A fast-moving average (set to a period of 10) tracks the immediate trends in momentum.
- Long-term Smoothing: A slower-moving average (set to a period of 30) identifies the broader, underlying trend of that momentum.
3. The Ratio Calculation The final and most unique feature of this script is the "Ratio" calculation. It takes the value of the short-term moving average and divides it by the long-term moving average, then converts it into a percentage.
What This Means for the Trader
By creating a ratio between two different momentum trends, the tool highlights the relationship between immediate price velocity and broader momentum trends.
- When the ratio shifts significantly, it can indicate that the current momentum is accelerating or decelerating relative to its historical average.
- The visual output provides four distinct lines: the raw RSI, the two smoothed moving averages (10 and 30), and the final Ratio line.
This allows a user to see not just where the price is going, but how "aggressively" that movement is happening compared to the established trend.
//+--------------------------------------------------------------+
//|                                                      MoR.mq4 |
//+--------------------------------------------------------------+
/*
Original template by Wolfe
Version 1 - modified by SolomonZhang
Version 2a - Modified by FXBS

All are members of Forex-TSD.com
*/
#property copyright "Wolfe"
#property link "xxxxwolfe@gmail.com"

#property indicator_separate_window
#property indicator_level1  100
#property indicator_level2  80
#property indicator_level3  50
#property indicator_level4  20
#property indicator_buffers 4
#property indicator_color1 Black    //RSI
#property indicator_color2 Blue     //MA1
#property indicator_color3 Red      //MA2
#property indicator_color4 Green    //Ratio

extern int  RSI_Timeframe=0;//0=current chart,1=m1,5=m5,15=m15,30=m30,60=h1,240=h4,etc...
int  RSI_Period = 10;
int  RSI_Applied_Price = 0;//0=close, 1=open, 2=high, 3=low, 4=(high+low)/2, 5=(high+low+close)/3, 6=(high+low+close+close)/4
int  MA1_Period = 10;
int  MA1_Method = 1;// 0=SMA, 1=EMA, 2=SMMA, 3=LWMA
int  MA2_Period = 30;
int  MA2_Method = 1;// 0=SMA, 1=EMA, 2=SMMA, 3=LWMA

double RSI[],MA1_Array[],MA2_Array[],MR_Ratio[];

//+------------------------------------------------------------------+
//| Custom indicator initialization function |
//+------------------------------------------------------------------+
int init()
{
//---- indicators setting
SetIndexStyle(0,DRAW_LINE,STYLE_SOLID,1); //RSI
SetIndexStyle(1,DRAW_LINE,STYLE_SOLID,1); //EMA10
SetIndexStyle(2,DRAW_LINE,STYLE_SOLID,1); //EMA30
SetIndexStyle(3,DRAW_LINE,STYLE_SOLID,2); //Ratio

SetIndexBuffer(0,RSI);
SetIndexLabel(0,"RSI");

SetIndexBuffer(1,MA1_Array);
SetIndexLabel(1,"MA1");

SetIndexBuffer(2,MA2_Array);
SetIndexLabel(2,"MA2");

SetIndexBuffer(3,MR_Ratio);
SetIndexLabel(3,"Ratio");

IndicatorDigits(MarketInfo(Symbol(),MODE_DIGITS));
IndicatorShortName("MoR");

return(0);
}

//+------------------------------------------------------------------+
//| Custom indicator iteration function |
//+------------------------------------------------------------------+
int start()
{
   int  counted_bars=IndicatorCounted();
   int  i,limit;

   if (counted_bars<0) return(-1);
   if (counted_bars>0) counted_bars--;
         limit=Bars-counted_bars;

   //+------------------------------------------------------------------+
   //| RSI |
   //+------------------------------------------------------------------+

 for(i=limit; i>=0; i--)
 RSI[i]= iRSI(NULL,RSI_Timeframe,RSI_Period,RSI_Applied_Price,i);

   //+------------------------------------------------------------------+
   //| EMA 10 & 30 |
   //+------------------------------------------------------------------+

 for (i=0; i<=limit; i++)
 {

      MA1_Array[i] = iMAOnArray(RSI,0,MA1_Period,0,MA1_Method,i);
      MA2_Array[i] = iMAOnArray(RSI,0,MA2_Period,0,MA2_Method,i);

   //+------------------------------------------------------------------+
   //| Ratio of EMA 10 & 30 |
   //+------------------------------------------------------------------+

      if (MA2_Array[i]!=0)
      MR_Ratio[i] = MA1_Array[i] / MA2_Array[i] * 100;
   }

   //----
   return(0);
}
Comments