0_MoR_signalTable_test1
Download script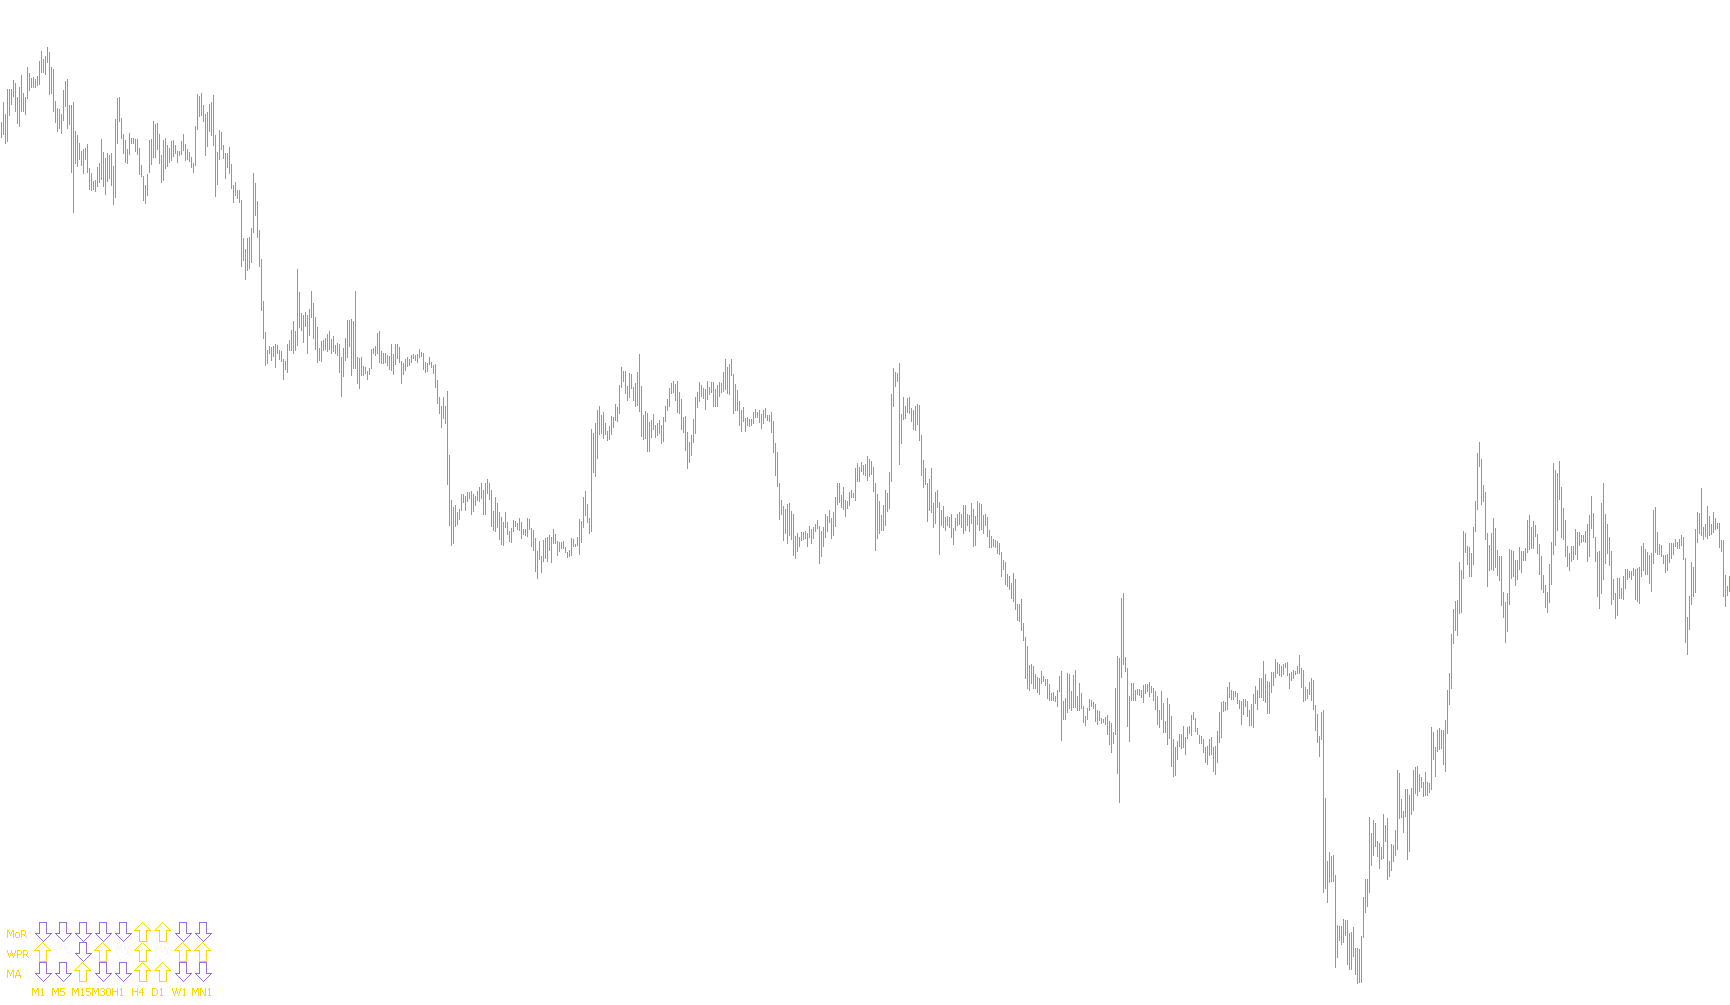
This script functions as a multi-timeframe visual dashboard designed to provide real-time market sentiment analysis at a glance. Instead of requiring you to switch between different charts to see what is happening on various timeframes, this tool compiles that data into a single, organized grid directly on your main trading screen.
Core Functionality
The script monitors nine distinct timeframes simultaneously—ranging from the 1-minute chart up to the monthly chart. For each of these timeframes, it tracks three specific technical indicators to generate visual "Buy," "Sell," or "Neutral" signals. These signals are displayed as icons (using specialized Wingdings symbols) that change color dynamically based on market conditions.
The Indicators Analyzed
The dashboard processes three different types of logic for every timeframe:
-
Moving Average Analysis: The script compares short-term price trends against long-term averages. If the short-term trend is higher than the long-term average, it indicates upward momentum (Buy); otherwise, it signals downward momentum (Sell).
-
Williams %R (Overbought/Oversold): This logic identifies extreme market conditions. It looks for areas where the price has stretched too far in one direction. If the value is exceptionally low, it suggests an "oversold" state (potential Buy); if it is exceptionally high, it suggests an "overbought" state (potential Sell). If the price is in a normal range, it displays a neutral status.
-
Custom MoR Indicator: The script incorporates a specialized custom calculation (MoR) that combines RSI periods and multiple Moving Average methods. It checks specific thresholds to determine the final signal for this component, providing a refined layer of analysis beyond standard indicators.
Visual Layout and User Experience
- Organized Dashboard: The information is laid out in a structured grid. Each row represents a different indicator type (MA, WPR, and MoR), while each column represents a different timeframe (M1, M5, H1, D1, etc.).
- Color Coding: To allow for instant recognition, the dashboard uses distinct colors:
- Gold/Purple: Used to quickly differentiate between Buy and Sell signals.
- White/Grey: Used to indicate a "No Signal" or neutral state, ensuring that you only focus on active opportunities.
- Clean Interface: The script is designed to be non-intrusive. It automatically creates all necessary labels and icons when loaded and cleans up the chart entirely when removed, ensuring your workspace remains tidy.
Summary for the Trader
This tool acts as a "command center." By looking at one screen, you can see if the 5-minute chart is bullish while the Daily chart is bearish, allowing you to make more informed decisions about trend alignment and market structure without clicking through multiple windows.
//////////////////////////////////////////////////////////////////////
//
//                                                  signalTable.mq4
//                                                     Antonuk Oleg
//                                            antonukoleg@gmail.com
//
//////////////////////////////////////////////////////////////////////
// sar-mor test
#property copyright "Antonuk Oleg"
#property link      "antonukoleg@gmail.com"

#property indicator_chart_window

extern int scaleX=20,
           scaleY=20,
           offsetX=35,
           offsetY=20,
           fontSize=20,
           corner=2,
           symbolCodeBuy=241,//67,
           symbolCodeSell=242,//68,
           symbolCodeNoSignal=73; //243

extern color signalBuyColor=Gold,
             signalSellColor=MediumPurple,
             noSignalColor=WhiteSmoke,
             textColor=Gold;
extern string  note_MoR_settings   = "TF=0; mamethod: 0=SMA, 1=EMA, 2=SMMA, 3=LWMA; Price = 0C 1O 2H 3L 4Md 5Tp 6WghC: Md(HL/2)4,Tp(HLC/3)5,Wgh(HLCC/4)6";
extern int  RSI_Period = 10;
extern int  RSI_Applied_Price = 0;//0=close, 1=open, 2=high, 3=low, 4=(high+low)/2, 5=(high+low+close)/3, 6=(high+low+close+close)/4
extern int  MA1_Period = 10;
extern int  MA1_Method = 1;// 0=SMA, 1=EMA, 2=SMMA, 3=LWMA
extern int  MA2_Period = 30;
extern int  MA2_Method = 1;// 0=SMA, 1=EMA, 2=SMMA, 3=LWMA

int period[]={1,5,15,30,60,240,1440,10080,43200};
string periodString[]={"M1","M5","M15","M30","H1","H4","D1","W1","MN1"},
       // ñîçäàåì åùå îäèí ìàññèâ ñ íàçâàíèÿìè èíäèêàòîðîâ
//       signalNameString[]={"MA","WPR","SAR"};
       signalNameString[]={"MA","WPR","MoR"};

//////////////////////////////////////////////////////////////////////
//
// init()
//
//////////////////////////////////////////////////////////////////////
int init()
{
   // òàáëèöà ñèãíàëîâ
   for(int x=0;x<9;x++)
      for(int y=0;y<3;y++)
      {
         ObjectCreate("signal"+x+y,OBJ_LABEL,0,0,0,0,0);
         // èçìåíÿåì óãîë ïðèâÿçêè
         ObjectSet("signal"+x+y,OBJPROP_CORNER,corner);
         ObjectSet("signal"+x+y,OBJPROP_XDISTANCE,x*scaleX+offsetX);
         ObjectSet("signal"+x+y,OBJPROP_YDISTANCE,y*scaleY+20);
         ObjectSetText("signal"+x+y,CharToStr(symbolCodeNoSignal),
                       fontSize,"Wingdings",noSignalColor);
      }

  // íàçâàíèÿ òàéìôðåéìîâ
  for(x=0;x<9;x++)
  {
      ObjectCreate("textPeriod"+x,OBJ_LABEL,0,0,0,0,0);
      // èçìåíÿåì óãîë ïðèâÿçêè
      ObjectSet("textPeriod"+x,OBJPROP_CORNER,corner);
      ObjectSet("textPeriod"+x,OBJPROP_XDISTANCE,x*scaleX+offsetX);
      ObjectSet("textPeriod"+x,OBJPROP_YDISTANCE,offsetY-10);
      ObjectSetText("textPeriod"+x,periodString[x],8,"Tahoma",textColor);
  }

    for(x=0;x<9;x++)
  {
      ObjectCreate("IndValue"+x,OBJ_LABEL,0,0,0,0,0);
      // èçìåíÿåì óãîë ïðèâÿçêè
      ObjectSet("IndValue"+x,OBJPROP_CORNER,corner);
      ObjectSet("IndValue"+x,OBJPROP_XDISTANCE,x*scaleX+offsetX);
      ObjectSet("IndValue"+x,OBJPROP_YDISTANCE,offsetY-10);
      ObjectSetText("IndValue"+x,periodString[x],8,"Tahoma",textColor);
  }


  // íàçâàíèÿ èíäèêàòîðîâ
  for(y=0;y<3;y++)
  {
      ObjectCreate("textSignal"+y,OBJ_LABEL,0,0,0,0,0);
      // èçìåíÿåì óãîë ïðèâÿçêè
      ObjectSet("textSignal"+y,OBJPROP_CORNER,corner);
      ObjectSet("textSignal"+y,OBJPROP_XDISTANCE,offsetX-25);
      ObjectSet("textSignal"+y,OBJPROP_YDISTANCE,y*(scaleY)+offsetY+8);
      ObjectSetText("textSignal"+y,signalNameString[y],8,"Tahoma",textColor);
  }
  return(0);
}

int start()
{
   for(int x=0;x<9;x++)
   {
      // ñèãíàë íà ïîêóïêó
      if(iMA(Symbol(),period[x],13,0,0,0,0)>iMA(Symbol(),period[x],24,0,0,0,0))
         ObjectSetText("signal"+x+"0",CharToStr(symbolCodeBuy),fontSize,"Wingdings",signalBuyColor);
      // ñèãíàë íà ïðîäàæó
      else
         ObjectSetText("signal"+x+"0",CharToStr(symbolCodeSell),fontSize,"Wingdings",signalSellColor);
   }

   for(x=0;x<9;x++)
   {
      // ñèãíàë íà ïîêóïêó
      if(MathAbs(iWPR(Symbol(),period[x],13,0))<20.0)
         ObjectSetText("signal"+x+"1",CharToStr(symbolCodeBuy),fontSize,"Wingdings",signalBuyColor);
      // ñèãíàë íà ïðîäàæó
      else if(MathAbs(iWPR(Symbol(),period[x],13,0))>80.0)
         ObjectSetText("signal"+x+"1",CharToStr(symbolCodeSell),fontSize,"Wingdings",signalSellColor);
      // íåò ñèãíàëà
      else
         ObjectSetText("signal"+x+"1",CharToStr(symbolCodeNoSignal),fontSize,"Wingdings",noSignalColor);
   }

   for(x=0;x<9;x++)
   {
      // ñèãíàë íà ïîêóïêó
      if(iCustom (Symbol(),period[x],"0_MoR2a",0,RSI_Period,RSI_Applied_Price,
               MA1_Period,MA1_Method,MA2_Period,MA2_Method,3,0)  >100)
         ObjectSetText("signal"+x+"2",CharToStr(symbolCodeBuy),fontSize,"Wingdings",signalBuyColor);
      // ñèãíàë íà ïðîäàæó
      else
         ObjectSetText("signal"+x+"2",CharToStr(symbolCodeSell),fontSize,"Wingdings",signalSellColor);
   }


   return(0);
}

//////////////////////////////////////////////////////////////////////
//
//  deinit()
//
//////////////////////////////////////////////////////////////////////
int deinit()
{
   // ïðè óäàëåíèè íàøåãî èíäèêàòîðà íóæíî óäàëèòü âñå îáúåêòû,
   // êîòîðûå ìû óæå ñîçäàëè

   ObjectsDeleteAll();
   return(0);
}
Comments