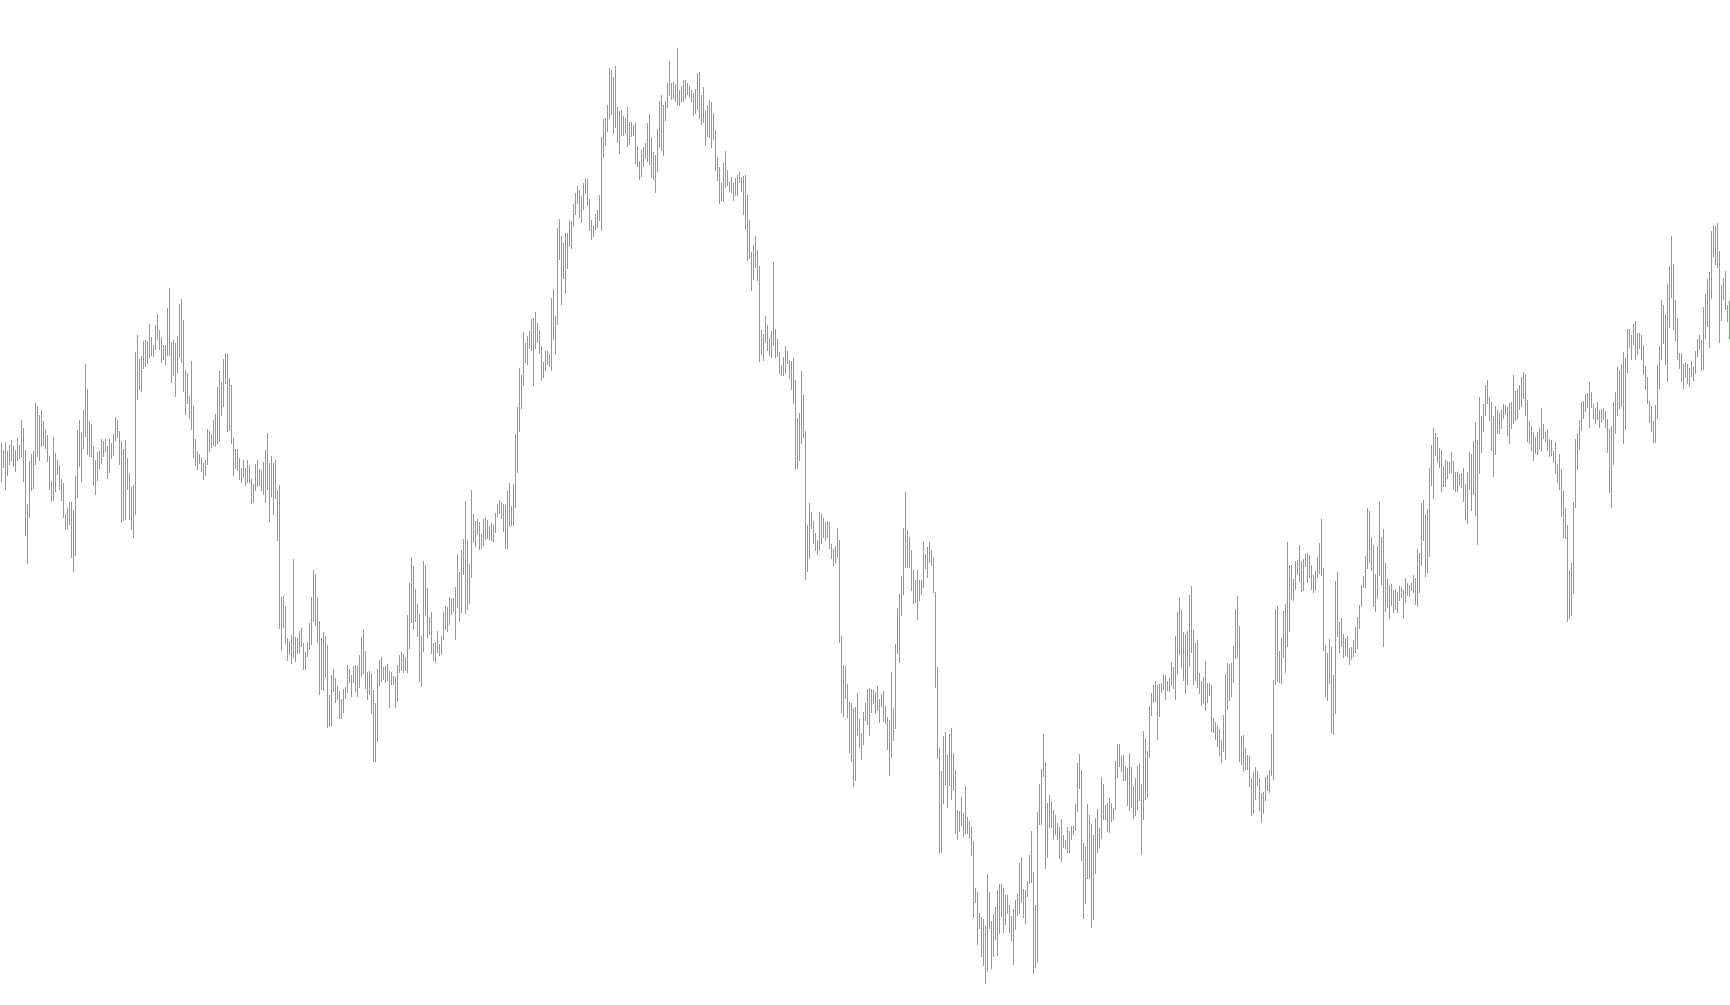
This script is designed to visually represent price movements on a trading chart by coloring the "candles" (the visual representation of price changes over a specific period) based on the relationship between two moving averages. Think of a moving average as a line that smooths out price data over time, giving you an idea of the overall trend.
Here's the breakdown:
-
Moving Averages: The script uses two moving averages. The first moving average's settings are fixed within the code. The second moving average's settings are customizable through the script's input parameters, like the period (how many past data points to average), shift (offset the moving average), method of calculation (e.g., simple, exponential), and the price to use (e.g., close, open).
-
Comparison: For each candle on the chart, the script compares the values of these two moving averages at that point in time.
-
Color Coding: The script then color-codes the candle based on which moving average is higher:
- If the first (fixed) moving average is higher than the second (customizable) moving average, the candle is colored in a specific shade of blue.
- If the second (customizable) moving average is higher than the first (fixed) moving average, the candle is colored in a shade of red.
-
Visual Representation: Instead of just coloring the entire candle one color, the script colors the "wicks" (the lines extending above and below the candle body showing the high and low prices) and the "body" (the rectangle showing the opening and closing prices) separately, each according to the above rules. This provides a more detailed visual representation of the price action relative to the moving averages. The script essentially draws the candle using a series of histograms representing the wicks and body, each potentially colored differently.
In essence, this script aims to give traders a quick visual indication of whether the price is trending above or below a certain average, using the relationship between two moving averages as the determining factor. The colors help traders quickly see potential buy or sell signals based on these moving average crossovers or relationships.
//+------------------------------------------------------------------+
//|                                  0 - MA - Candles Two Colors.mq4 |
//|                        Copyright 2013, MetaQuotes Software Corp. |
//|                                              http://www.mql5.com |
//+------------------------------------------------------------------+
#property copyright "Copyright 2013, MetaQuotes Software Corp."
#property link      "http://www.mql5.com"
#property version   "1.00"
#property strict
#property indicator_chart_window

//+------------------------------------------------------------------+
//| MA Candles Two Colors: Copylight © 2013, File45 (Phylo)       |
//| http://codebase.mql4.com/en/author/file45
//|
//| Thanks to Mladen for code enhancements: http://www.forex-tsd.com/metatrader-4/20171-please-fix-indicator-ea-82.html                                            |
//+------------------------------------------------------------------+

#property indicator_buffers 4
#property indicator_color1 RoyalBlue//wicks
#property indicator_color2 Red//wicks
#property indicator_color3 RoyalBlue // Candle Bodies
#property indicator_color4 Red // Candle Bodies

input int Candle_MA_Period =200; // Candle MA Period
input int Candle_MA_Shift = 0; // Candle MA Shift
input ENUM_MA_METHOD Candle_Type = 3; // Candle MA Method
input ENUM_APPLIED_PRICE Candle_MA_Price = 4; // Candle Price
input int Candle_Shadow_Width = 1;
input int Candle_Body_Width = 3;

int MA1 = 1;
int MA1_MODE = 0;
int MA1_PRICE = 0;
int MA1_SHIFT = 0;

// ======================== indicator buffers

double Bar1[], Bar2[], Candle1[], Candle2[];

double MA_1 (int i = 0){return(iMA(NULL,0,MA1,MA1_SHIFT,MA1_MODE, MA1_PRICE,i));}
double MA_2 (int i = 0){return(iMA(NULL,0,Candle_MA_Period,Candle_MA_Shift,Candle_Type, Candle_MA_Price,i));}

//+------------------------------------------------------------------+
//| Custom indicator initialization function                         |
//+------------------------------------------------------------------+
int OnInit()
{
   ChartSetInteger(0,CHART_MODE,CHART_LINE);
   ChartSetInteger(0,CHART_COLOR_CHART_LINE,clrNONE);

   IndicatorShortName("MA Candles");
   IndicatorBuffers(4);

   SetIndexBuffer(0,Bar1);
   SetIndexBuffer(1,Bar2);
   SetIndexBuffer(2,Candle1);
   SetIndexBuffer(3,Candle2);

   SetIndexStyle(0,DRAW_HISTOGRAM,0,Candle_Shadow_Width);
   SetIndexStyle(1,DRAW_HISTOGRAM,0,Candle_Shadow_Width);
   SetIndexStyle(2,DRAW_HISTOGRAM,0,Candle_Body_Width);
   SetIndexStyle(3,DRAW_HISTOGRAM,0,Candle_Body_Width);

// ======================== Data Window Truth Table: R up L is Red Candle up Low; R dn L is Red Candle down Low, etc,.

   SetIndexLabel(0, "R up L, R dn L, B up H, B dn H");
   SetIndexLabel(1, "R up H, R dn H, B up L, B dn L");
   SetIndexLabel(2, "R up O, R dn C, B up C, B dn O");
   SetIndexLabel(3, "R up C, R dn O, B up O, B dn C");

   return(INIT_SUCCEEDED);
}
//+------------------------------------------------------------------+
//| Custom indicator iteration function                              |
//+------------------------------------------------------------------+
int OnCalculate(const int rates_total,
                const int prev_calculated,
                const datetime &time[],
                const double &open[],
                const double &high[],
                const double &low[],
                const double &close[],
                const long &tick_volume[],
                const long &volume[],
                const int &spread[])
{
   for(int i = MathMax(Bars-1-IndicatorCounted(),1); i>=0; i--)
   {
      double	Ma1 = MA_1(i);
      double	Ma2 = MA_2(i);

      if(Ma1 > Ma2)
      {
         SetCandleColor(1,i);
      }
      else
      {
         if(Ma1 < Ma2) SetCandleColor(2,i);
      }

     /* string Label1="",Label2="";

      if(MA1_MODE==0)Label1="MA";
      if(MA2_MODE==0)Label2="MA";
      if(MA1_MODE==1)Label1="EMA";
      if(MA2_MODE==1)Label2="EMA";
      if(MA1_MODE==2)Label1="SMMA";
      if(MA2_MODE==2)Label2="SMMA";
      if(MA1_MODE==3)Label1="LWMA";
      if(MA2_MODE==3)Label2="LWMA";*/
   }

   return(rates_total);
}

void SetCandleColor(int col, int i)
{
   double high,low,bodyHigh,bodyLow;

   bodyHigh = MathMax(Open[i],Close[i]);
   bodyLow = MathMin(Open[i],Close[i]);
   high = High[i];
   low = Low[i];

   Bar1[i]    = EMPTY_VALUE;
   Bar2[i]    = EMPTY_VALUE;
   Candle1[i] = EMPTY_VALUE;
   Candle2[i] = EMPTY_VALUE;

   switch(col)
   {
      case 1: Bar1[i] = high; Bar2[i] = low; Candle1[i] = bodyHigh; Candle2[i] = bodyLow; break;
      case 2: Bar2[i] = high; Bar1[i] = low; Candle2[i] = bodyHigh; Candle1[i] = bodyLow; break;
   }
}
Comments