zz_iGDR_ZZ
Download script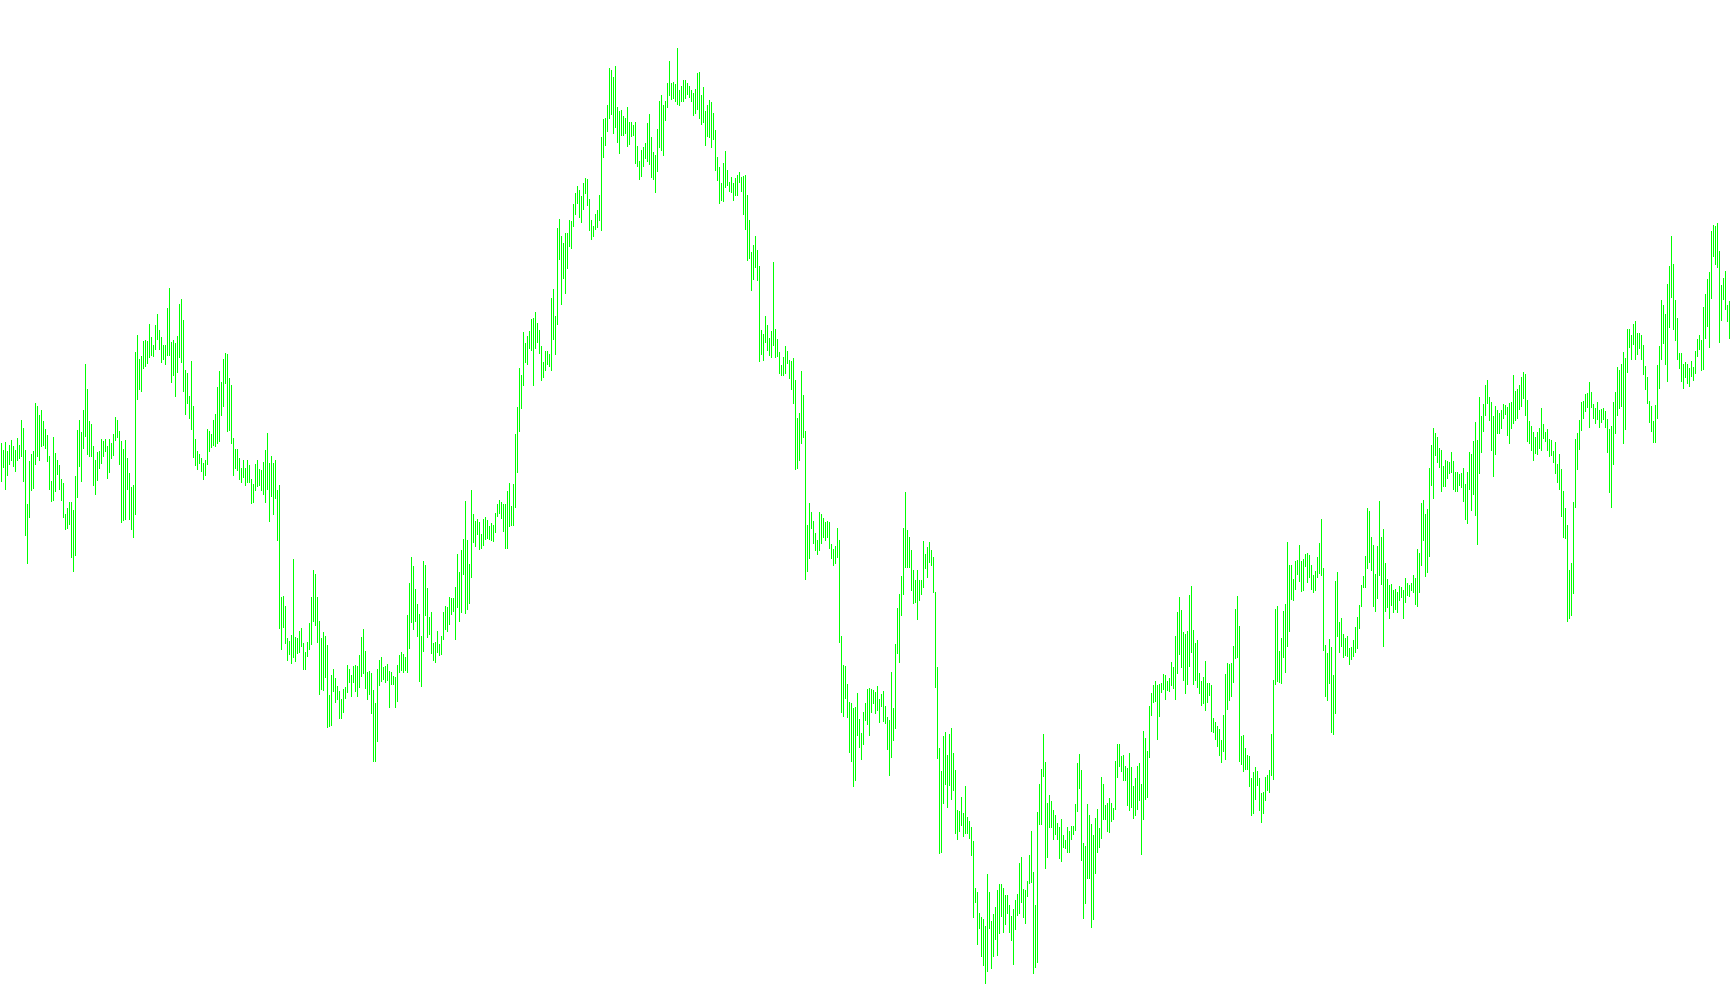
The ZigZag Color indicator is designed to help traders visualize market structure by identifying significant price swings, trends, and key reversal points on a trading chart. Rather than showing every minor price fluctuation, it filters out "noise" to highlight the primary direction of the market.
Core Functionality
The script automatically tracks price movements to determine whether the market is currently in an upward (bullish) or downward (bearish) trend. It achieves this by identifying "peaks" and "valleys." When the price moves significantly enough in one direction, the indicator draws a line connecting these points, effectively sketching out the skeleton of the price action.
How the Logic Works
The indicator operates using three main logical components:
1. Trend Identification and Detection The script continuously monitors new price data. It looks for specific price breaks to decide when a trend has shifted:
- In an Uptrend: It watches for new highs that exceed previous levels. If the price fails to reach these heights and begins to drop significantly, the script identifies this as a potential reversal.
- In a Downtrend: It watches for new lows. If the price stays above these lows but moves up significantly, it flags a shift in momentum.
- Trend Exhaustion: The logic includes a "flat" parameter. This ensures that if the price remains stagnant for too long without making significant progress, the script can proactively look for the next logical swing point to keep the chart updated.
2. Dynamic Level Calculation A unique feature of this script is how it calculates the distance between points. It doesn't just use a fixed number; it analyzes the historical volatility (the average range of price movements) over a specific period. This allows the indicator to adapt to different market conditions—meaning it can stay sensitive during high-volatility periods and become more stable during quieter, less active trading sessions.
3. Visual Mapping Once a new peak or valley is confirmed:
- The script calculates the "path" between the old point and the new point.
- It draws distinct lines to represent the move.
- By providing these clear visual paths, it allows traders to see the history of price swings clearly, making it easier to identify support and resistance zones where the price has historically turned around.
Summary for the User
Think of this indicator as a "map maker" for your charts. It ignores the minor zig-zags of daily trading and draws a clear line connecting the major milestones. By following these lines, you can better see the overall flow of the market, identify when a trend is losing steam, and spot potential entry or exit points based on significant price reversals.
// Indicators Pack - Green Digger Reseach
//+------------------------------------------------------------------+
//|                                            [IP-GDR] ZigZag color |
//|                          Copyright © 2008-2009, GreenDog, Russia |
//|                                                    krot@inbox.ru |
//+------------------------------------------------------------------+
#property copyright "Copyright © 2008-2009, GreenDog"
#property link      "krot@inbox.ru"

#property indicator_chart_window
#property indicator_buffers 3
#property indicator_color1 Gold
#property indicator_color2 DarkGreen
#property indicator_color3 Red
#property indicator_width1 1
#property indicator_width2 2
#property indicator_width3 2

extern double extHL = 5;   // êîýô äëÿ ñðåäíåãî HL, îïðåäåëÿþùåãî ïóòü â ïóíêòàõ, ïðè êîòîðîì âåðøèíà ñ÷èòàåòñÿ óñòàíîâëåííîé
extern int extFlat = 48;   // êîëè÷åñòâî áàðîâ ôëåòà, êîãäà âåðøèíà ðèñóåòñÿ ïðèíóäèòåëüíî
extern int sBars = 480;    // show bars

double aUP[],aDW[],aMA[];

double lastLevel[2],kickLevel,lastHL,aLv[3];
bool Go = true, first = true;
int trend,lastLow,lastHigh;

int init(){
   IndicatorBuffers(3);
   SetIndexBuffer(0,aMA);
   SetIndexBuffer(1,aUP);
   SetIndexBuffer(2,aDW);
   SetIndexStyle(0,DRAW_ARROW); SetIndexArrow(0,250);
   SetIndexStyle(1,DRAW_LINE);
   SetIndexStyle(2,DRAW_LINE);
   SetIndexEmptyValue(0,EMPTY_VALUE);
   SetIndexEmptyValue(1,EMPTY_VALUE);
   SetIndexEmptyValue(2,EMPTY_VALUE);
   IndicatorDigits(Digits+1);

   if (sBars!=0 && sBars<2) { Go=false; return(-1); }
   if (sBars==0) sBars=10000;
   return(0);
}

int deinit(){
   Comment("");
}

int start(){
   int lastBars,count;

   if (!Go) { Comment("ind.parameters incorrect!"); return(-1); }
   if (Bars<sBars+extFlat) { Comment("not enough bars on the chart!"); return(0); }
   else Comment("");
//   if (Bars==lastBars) return(0); // åñëè ìåäëåííûé, ñ÷èòàåì òîêà â íà÷àëå áàðà
   if (Bars-lastBars<=1){
      if (Bars-lastBars==1) { lastHigh++; lastLow++; }
      count=Bars-lastBars;
   }
   else {
      ArrayInitialize(aMA,EMPTY_VALUE); ArrayInitialize(aUP,EMPTY_VALUE); ArrayInitialize(aDW,EMPTY_VALUE); first=true;
   }
   lastBars=Bars;

   if (first){ // ïðè ïåðâîì çàïóñêå îïðåäåëÿåì ñðåäíåå õë
      double HL=0;
      lastHL=0;
      for(int i=Bars;i>=0;i--) { HL=HL+High[i]-Low[i]; if (i==sBars) lastHL=HL; }
      lastHL=NormalizeDouble(extHL*(MathSqrt(HL/Bars*(HL-lastHL)/sBars)),Digits);
//      lastHL=NormalizeDouble(extHL*(HL/Bars+(HL-lastHL)/sBars)/2,Digits);
//      lastHL=NormalizeDouble(extHL*HL/Bars,Digits);
      // îïðåäåëÿåì ïåðâóþ òî÷êó
      double min=iLowest(NULL,0,MODE_LOW,extFlat,sBars);
      double max=iHighest(NULL,0,MODE_HIGH,extFlat,sBars);
      if (max<min){ // åñëè ïîñëåäíÿÿ âåðøèíà high
         lastLow=min; pushHigh(max); count=max;
      }
      else { // åñëè ïîñëåäíÿÿ âåðøèíà low
         lastHigh=max; pushLow(min); count=min;
      }
      first=false;
   }

   // îñíîâíîé öèêë
   for(i=count;i>=0;i--){
      if (trend==OP_BUY){ // ëó÷ ââåðõ
         if (High[i]>aLv[1]) pushHigh(i); // åñëè îáíîâëåíèå õàé
         else if (Low[i]<aLv[2] || Low[i]<aLv[0]) pushLow(i); // çàäåëè óðîâíè îòñòàþùåãî èëè ïðåäûäóùåãî ëîó
         else if (lastHigh-i>extFlat) pushLow(iLowest(NULL,0,MODE_LOW,extFlat,i)); // íå ïîðà ëè ñìåíèòü òðåíä
      }
      else { // ëó÷ âíèç
         if (Low[i]<aLv[1]) pushLow(i); // åñëè îáíîâëåíèå low
         else if (High[i]>aLv[2] || High[i]>aLv[0]) pushHigh(i); // çàäåëè óðîâíè îòñòàþùåãî èëè ïðåäûäóùåãî õàé
         else if (lastLow-i>extFlat) pushHigh(iHighest(NULL,0,MODE_HIGH,extFlat,i)); // íå ïîðà ëè ñìåíèòü òðåíä
      }
   }

   return(0);
}

void pushHigh(int sh){
   lastHigh=sh; trend=OP_BUY; aMA[sh]=High[sh];
   aLv[0]=Low[lastLow]; aLv[1]=High[lastHigh]; aLv[2]=aLv[1]-lastHL;
   int count=lastLow-lastHigh; // ïðîðèñîâêà è çàïîëíåíèå áóôåðîâ
   for(int i=0;i<=count;i++) aUP[lastLow-i]=Low[lastLow]+i*(High[sh]-Low[lastLow])/count;
   return(0);
}

void pushLow(int sh){
   lastLow=sh; trend=OP_SELL; aMA[sh]=Low[sh];
   aLv[0]=High[lastHigh]; aLv[1]=Low[lastLow]; aLv[2]=aLv[1]+lastHL;
   int count=lastHigh-lastLow; // ïðîðèñîâêà è çàïîëíåíèå áóôåðîâ
   for(int i=0;i<=count;i++) aDW[lastHigh-i]=High[lastHigh]-i*(High[lastHigh]-Low[sh])/count;
   return(0);
}
Comments