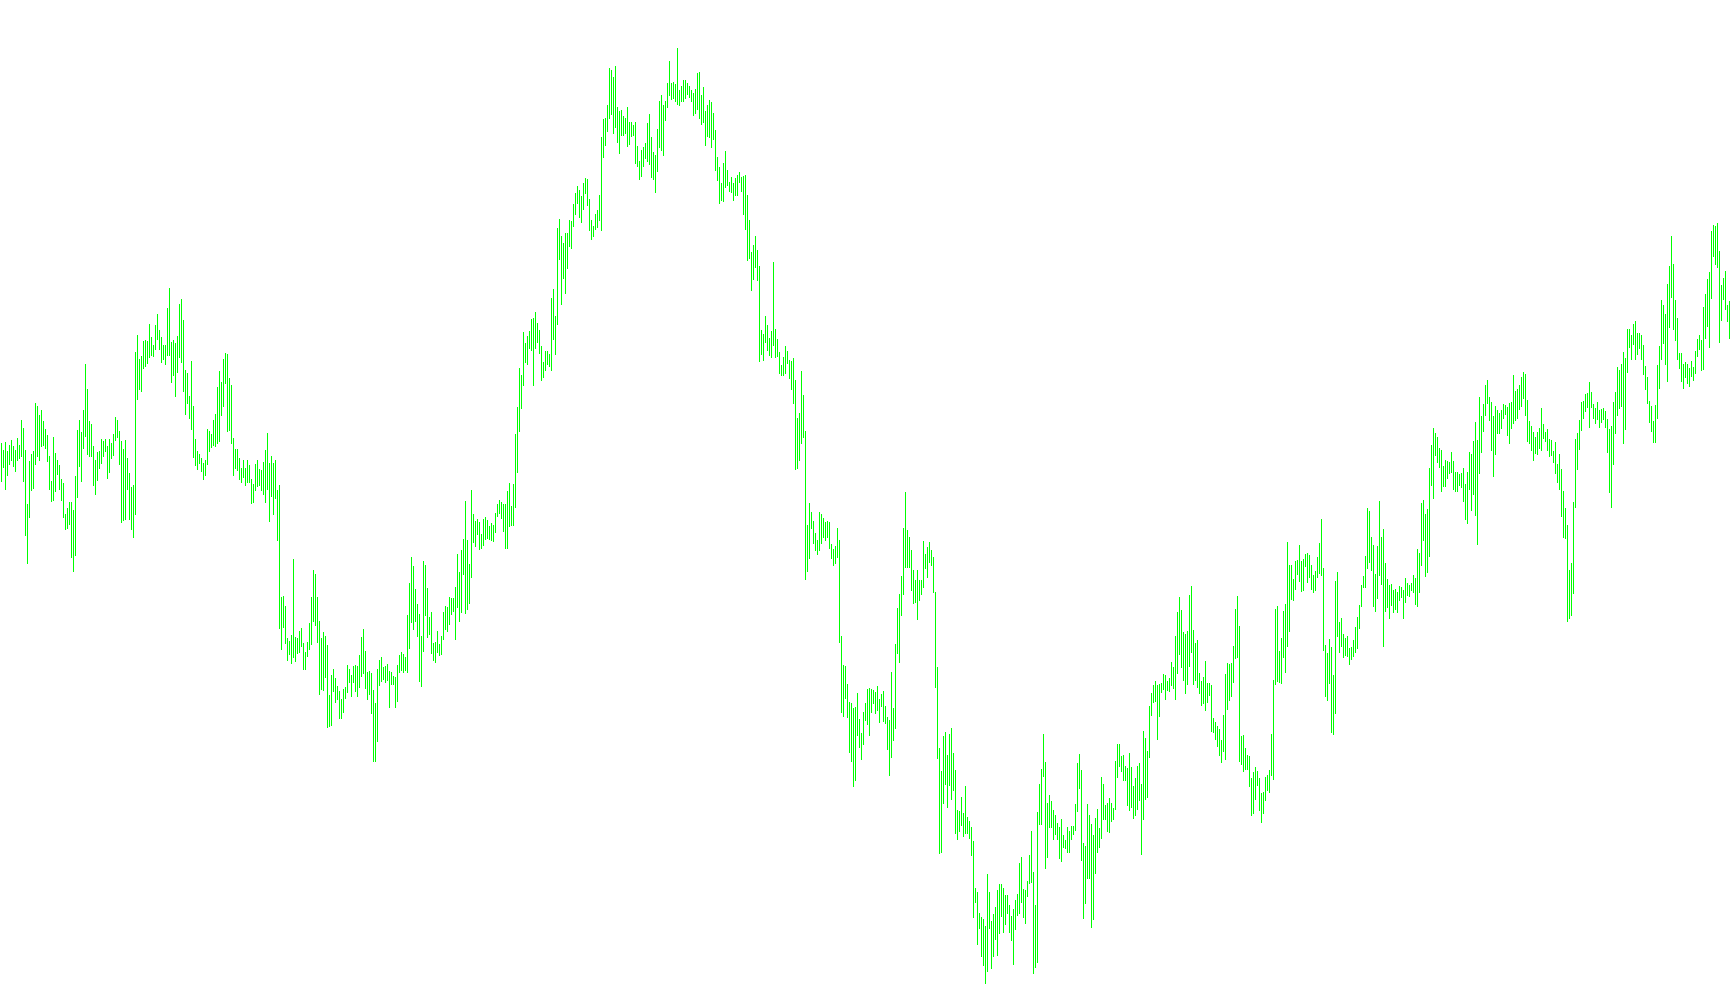
This script is designed to function as a visual aid on your trading charts, providing clear reference levels based on price movement. Rather than reacting to complex mathematical patterns or moving averages, it focuses on identifying specific "clean" price targets.
How the Logic Works
Price Standardization The primary goal of this tool is to identify a baseline price point for every candle on your chart. It takes the current closing price and automatically rounds it to the nearest whole number (or a significant decimal, depending on the asset's specific pricing structure). This helps filter out the "noise" of minor fluctuations, giving you a stable anchor point.
Three-Line Reference System Once that baseline price is identified, the script automatically plots three distinct horizontal levels simultaneously:
- The Upper Boundary: A level positioned slightly above the rounded baseline.
- The Core Baseline: The exact rounded price point itself.
- The Lower Boundary: A level positioned slightly below the rounded baseline.
Visual Representation
On your chart, these levels appear as a set of three light gray marks. By displaying these three lines together, the tool creates a visible "zone" or corridor around the current price.
Key Benefits for the Trader
- Clutter Reduction: Instead of you having to manually calculate where the next significant round number is, the script does it automatically for every bar.
- Zone Awareness: By providing three lines instead of just one, it allows you to see the immediate price vicinity around a key level, helping you visualize support and resistance areas more clearly.
- Consistency: The tool treats every asset the same way, adjusting its internal math to ensure that whether you are trading high-value currencies or smaller assets, the visual spacing remains proportional and accurate.
//+------------------------------------------------------------------+
//|          _TRO_00_Lines                                           |
//|                                                                  |
//|                                                                  |
//+------------------------------------------------------------------+

#property indicator_chart_window

#property indicator_buffers 3

#property indicator_color1 LightGray
#property indicator_color2 LightGray
#property indicator_color3 LightGray

// indicators parameters

//---- buffers
double P1Buffer[];
double P2Buffer[];
double P3Buffer[];

double xPrice ;
int myStyle  = 2 ;

int myWingDing  = 250 ;

//+------------------------------------------------------------------+
//| Custom indicator initialization function                         |
//+------------------------------------------------------------------+
int init()
  {

   SetIndexBuffer(0, P1Buffer);
   SetIndexBuffer(1, P2Buffer);
   SetIndexBuffer(2, P3Buffer);

SetIndexArrow(0, myWingDing);
SetIndexArrow(1, myWingDing);
SetIndexArrow(2, myWingDing);

   SetIndexStyle(0, DRAW_ARROW, myStyle, 1);
   SetIndexStyle(1, DRAW_ARROW, myStyle, 1);
   SetIndexStyle(2, DRAW_ARROW, myStyle, 1);

   SetIndexEmptyValue(0,0);
   SetIndexEmptyValue(1,0);
   SetIndexEmptyValue(2,0);


   return(0);
  }
//+------------------------------------------------------------------+
//| Custom indicator deinitialization function                       |
//+------------------------------------------------------------------+
int deinit()
  {


   return(0);
  }
//+------------------------------------------------------------------+
//| Custom indicator iteration function                              |
//+------------------------------------------------------------------+
int start()
  {

   int i, dayi, counted_bars = IndicatorCounted();
//---- check for possible errors
   if(counted_bars < 0)
       return(-1);
//---- last counted bar will be recounted
   if(counted_bars > 0)
       counted_bars--;
   int limit = Bars - counted_bars;
//----


   for(i = limit - 1; i >= 0; i--)
     {

     if ( Point == 0.01 )  {xPrice = Close[i] - MathMod(Close[i],1.00) ; }
     else { xPrice = Close[i] - ( MathMod(100*Close[i],1.00)*0.01 ) ;  }

        P1Buffer[i] = xPrice + Point*100;
        P2Buffer[i] = xPrice ;
        P3Buffer[i] = xPrice - Point*100;

     } // for

   return(0);

  } // start
Comments