TrendArea
Download script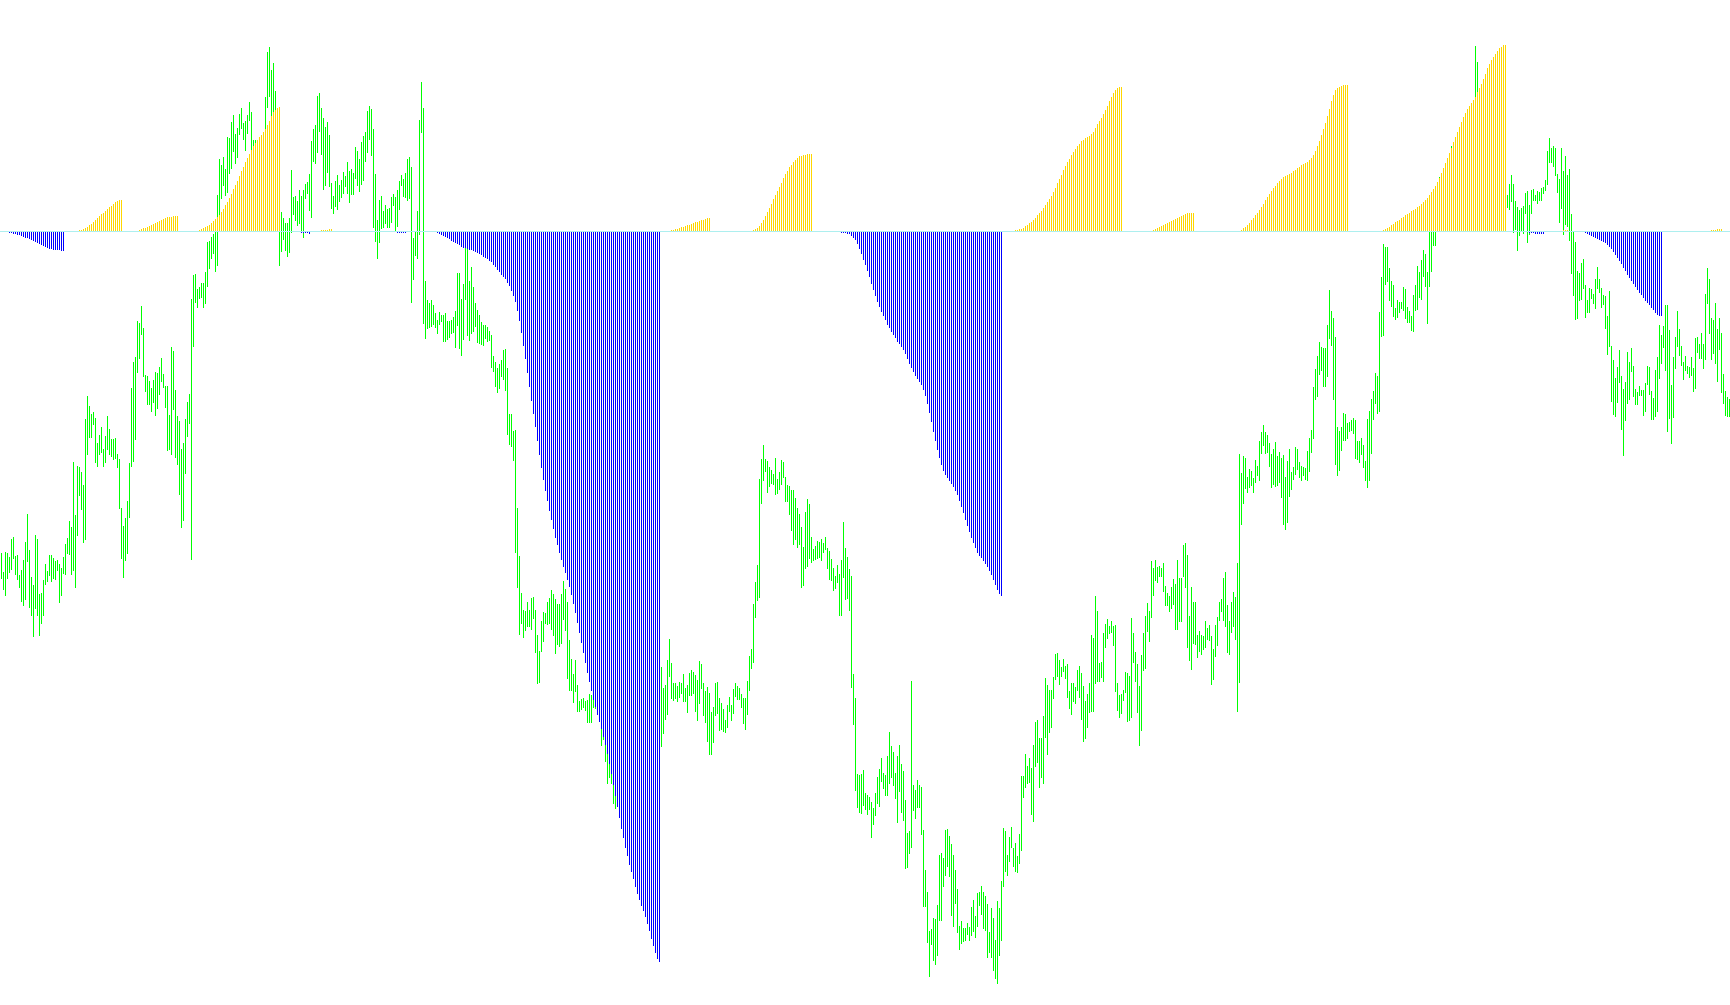
The TrendArea indicator is designed to help traders visualize the strength and direction of market momentum by analyzing the relationship between two moving averages. Instead of simply showing lines on a chart, this tool calculates a dynamic "area" or "zone" that reflects how far the price trend has moved in a specific direction over time.
How the Logic Works
1. Core Movement Analysis The script tracks two different moving averages: a "Fast" period and a "Slow" period. By comparing these two, the indicator identifies whether the short-term price momentum is pulling ahead of the long-term trend.
- When the Fast average moves above the Slow average, it signals bullish (upward) momentum.
- When the Fast average moves below the Slow average, it signals bearish (downward) momentum.
2. Momentum Tracking and "Crossings" The script is programmed to detect the exact moment these two averages cross paths. Whenever a crossover occurs, the indicator resets its internal counter. This allows the tool to differentiate between a new trend starting and the continuation of an existing one.
While moving in one direction, the indicator accumulates a value based on:
- The distance between the Fast and Slow moving averages.
- The duration for which the price has remained in that specific direction.
3. Visual Representation The results are displayed in a separate window below your main trading chart using a histogram style:
- Green Bars: These appear when the momentum is positive (bullish). The height of the bars represents the intensity of the upward trend.
- Red Bars: These appear when the momentum is negative (bearish). The bars extend downward to show the strength of the selling pressure.
- Scaling: Because the script multiplies the distance between the moving averages by a cumulative counter, the visual "area" expands as a trend becomes more established and powerful, providing a clear view of how much weight is behind the current market move.
Summary for Traders
Essentially, this tool translates complex moving average data into a visual representation of Trend Strength. Rather than just telling you where the price is going, it helps you see how strongly it is moving. Large bars indicate a powerful, sustained trend, while smaller bars suggest that momentum is weakening or consolidating.
//+------------------------------------------------------------------+
//|                                                        TrendArea |
//|                                                           mladen |
//+------------------------------------------------------------------+
#property copyright "copyleft mladen"
#property link      "mladenfx@gmail.com"

#property indicator_separate_window
#property indicator_buffers 3
#property indicator_color1 Green
#property indicator_color2 Red
#property indicator_color3 DimGray
#property indicator_width1 2
#property indicator_width2 2
#property indicator_style3 STYLE_DOT

//
//
//
//
//

extern int FastPeriod =  4;
extern int SlowPeriod = 15;
extern int MaMethod   = MODE_SMMA;

//
//
//
//
//

double gBuffer[];
double rBuffer[];
double zBuffer[];
double tBuffer[];
double aBuffer[];

//+------------------------------------------------------------------+
//|                                                                  |
//+------------------------------------------------------------------+
//
//
//
//
//

int init()
{
   IndicatorBuffers(5);
      SetIndexBuffer(0,gBuffer); SetIndexStyle(0,DRAW_HISTOGRAM);
      SetIndexBuffer(1,rBuffer); SetIndexStyle(1,DRAW_HISTOGRAM);
      SetIndexBuffer(2,zBuffer);
      SetIndexBuffer(3,tBuffer); SetIndexEmptyValue(3,0);
      SetIndexBuffer(4,aBuffer); SetIndexEmptyValue(4,0);

   //
   //
   //
   //
   //

   string ShortName;
   switch(MaMethod)
   {
      case 0 :  ShortName="TrendArea sma (";  break;
      case 1 :  ShortName="TrendArea ema (";  break;
      case 2 :  ShortName="TrendArea smma ("; break;
      case 3 :  ShortName="TrendArea lwma (";
   }

   IndicatorShortName(ShortName+FastPeriod+","+SlowPeriod+")");
   return(0);
}


//+------------------------------------------------------------------+
//|                                                                  |
//+------------------------------------------------------------------+
//
//
//
//
//

int start()
{
   int    countedBars = IndicatorCounted();
   int    i,limit;

   if (countedBars<0) return(-1);
   if (countedBars>0) countedBars--;
         limit = MathMin(Bars-countedBars,Bars-1);

   //
   //
   //
   //
   //

   for(i = limit; i >=0; i--)
   {
      double fastMa = iMA(NULL,0,FastPeriod,0,MaMethod,PRICE_CLOSE,i);
      double slowMa = iMA(NULL,0,SlowPeriod,0,MaMethod,PRICE_CLOSE,i);
      double fastMp = iMA(NULL,0,FastPeriod,0,MaMethod,PRICE_CLOSE,i+1);
      double slowMp = iMA(NULL,0,SlowPeriod,0,MaMethod,PRICE_CLOSE,i+1);

      //
      //
      //
      //
      //

      bool cross = ((fastMa>slowMa && fastMp<slowMp) || (fastMa<slowMa && fastMp>slowMp));
      if  (cross)
      {
         tBuffer[i] = 1;
         aBuffer[i] = 0;
      }
      else
      {
         tBuffer[i] = tBuffer[i+1];
            if (fastMa > slowMa) tBuffer[i] = tBuffer[i+1]+1;
            if (fastMa < slowMa) tBuffer[i] = tBuffer[i+1]-1;
         aBuffer[i] = aBuffer[i+1] + MathAbs(tBuffer[i])*MathAbs(fastMa-slowMa);
      }

      //
      //
      //
      //
      //

      zBuffer[i] = 0;
      gBuffer[i] = EMPTY_VALUE;
      rBuffer[i] = EMPTY_VALUE;
         if (tBuffer[i]>0)
               gBuffer[i] =  aBuffer[i];
         else  rBuffer[i] = -aBuffer[i];
   }

   //
   //
   //
   //
   //

   return(0);
}
Comments