Trend SMC v2
Download script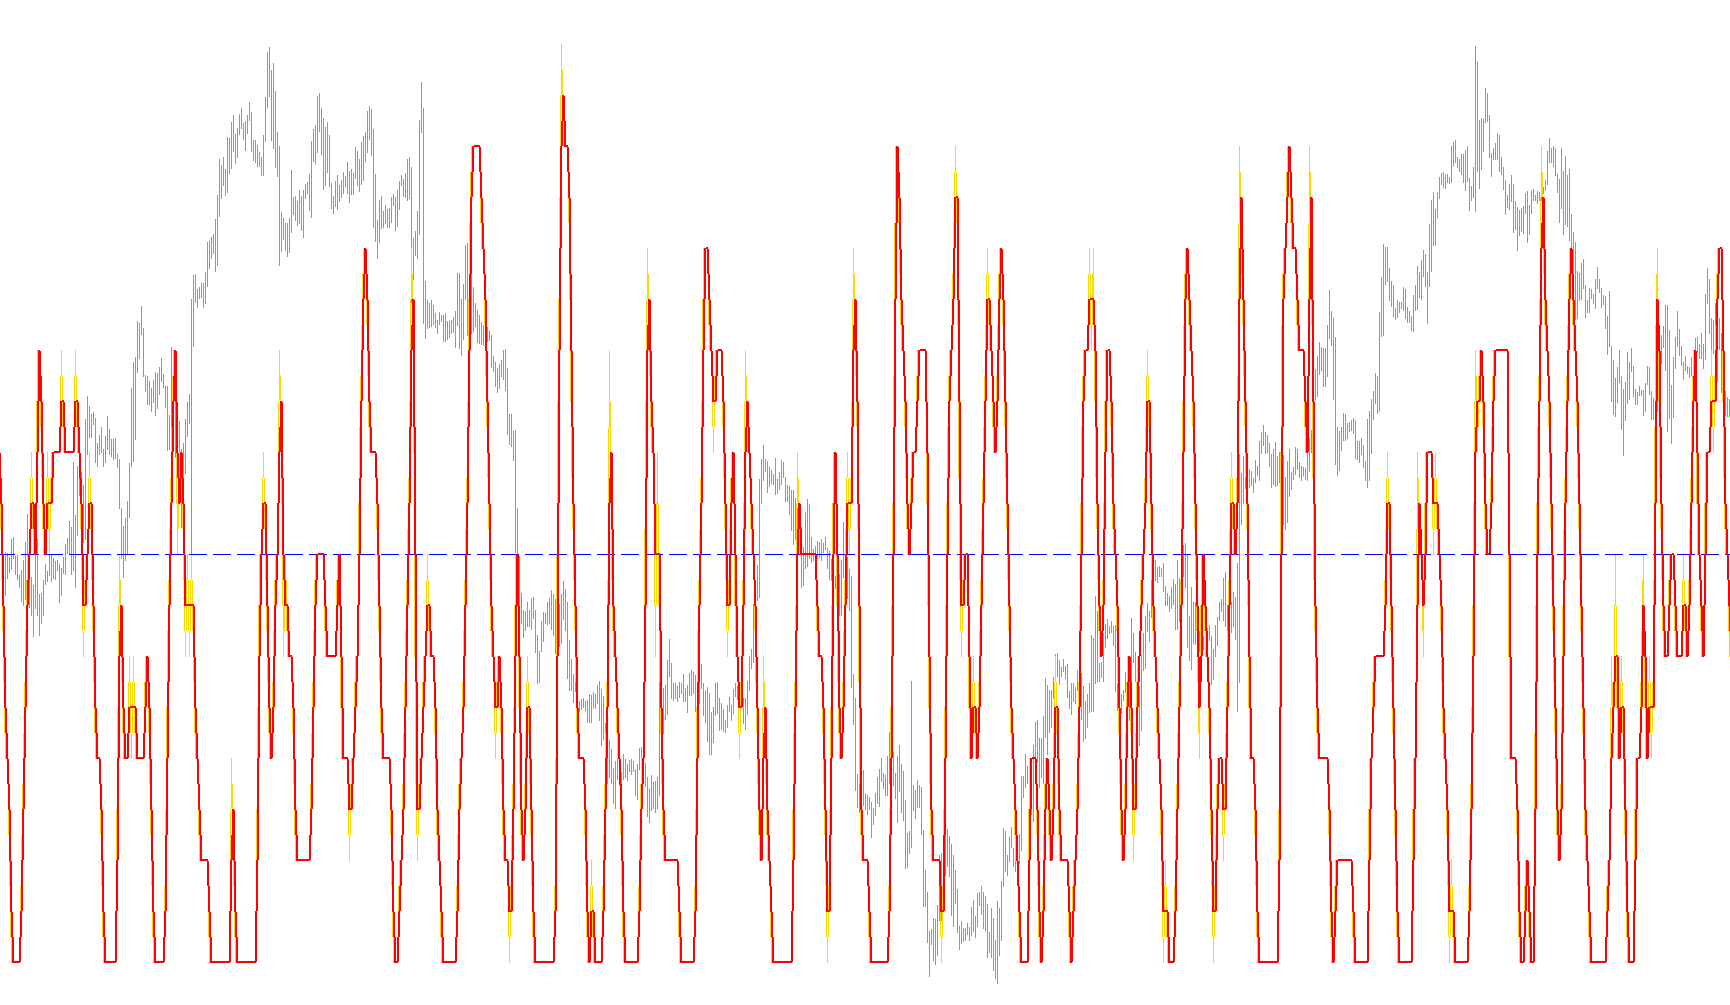
This tool is designed to help traders visualize market momentum and trend strength by analyzing the relationship between price action and moving averages. Instead of just showing a simple line on the main chart, it creates a separate visual indicator that tracks how frequently the market price "crosses" or interacts with its average value over a specific timeframe.
How the Logic Works
1. Establishing the Baseline (The Average) The script first looks at a set number of past data points (defined by the main period setting) to calculate a Simple Moving Average. This represents the "mean" price—essentially what the market considers its "fair value" at any given moment.
2. Measuring Interaction (The Count) Once the average is established, the script examines a smaller, more recent window of price activity. It looks at every individual candle within that window to see if the price moved above and below that average value.
- If a candle's high was above the average but its low was below it, the script counts this as an interaction.
- The goal here is to identify how much "noise" or "choppiness" is occurring around the average price.
3. Trend Strength Visualization The tool then takes these interaction counts and translates them into a visual trend line in a separate window:
- Activity Tracking: It plots how many times these interactions occurred over the specified period.
- Smoothing: To make the data easier to read, the script calculates a secondary average of these counts. This smooths out the jumps, helping you see if the frequency of interactions is increasing or decreasing.
What This Means for the Trader
By looking at this indicator, you are essentially viewing a "volatility and trend" map:
- When the indicator values are high and moving in a specific direction, it suggests a period of high activity where the price is constantly testing its average.
- The smoothing logic helps filter out minor fluctuations, allowing you to see the broader trend of market behavior more clearly.
In short, rather than just telling you where the price is, this script tells you how much the price is struggling or interacting with its own historical average, providing a clearer picture of the current market sentiment and trend stability.
//+------------------------------------------------------------------+
//|                                                    SMC Trend.mq4 |
//|                                                  Copyright © 2004|
//|                                                                  |
//+------------------------------------------------------------------+
#property copyright "Copyright © 2004"
#property link      "na"

#property indicator_separate_window
#property indicator_buffers 3
#property indicator_color1 DarkOliveGreen
#property indicator_color2 FireBrick
#property indicator_color3 Red


//---- input parameters
extern int TPeriodMA=24;
extern int TPeriodL= 8;
//---- buffers
double TBuffer[];
double HorizBuffer[];
double AvgBuffer[];
//+------------------------------------------------------------------+
//| Custom indicator initialization function                         |
//+------------------------------------------------------------------+
int init()
  {
   string short_name;
//---- indicator line
   SetIndexStyle(0,DRAW_LINE);
   SetIndexBuffer(0,TBuffer);
   SetIndexStyle(1,DRAW_LINE,1);
   SetIndexBuffer(1,HorizBuffer);
   SetIndexStyle(2,DRAW_LINE,0,2,Red);
   SetIndexBuffer(2,AvgBuffer);
//---- name for DataWindow and indicator subwindow label
   short_name="SMC Trend("+TPeriodMA+")";
   IndicatorShortName(short_name);
   SetIndexLabel(0,short_name);
//----
   SetIndexDrawBegin(0,TPeriodMA);
   SetIndexDrawBegin(1,TPeriodMA);
   SetIndexDrawBegin(2,TPeriodMA);
//----
   return(0);
  }
//+------------------------------------------------------------------+
//| Trend                                                        |
//+------------------------------------------------------------------+
int start()
  {
   int i,x,cnt;
   int counted_bars=IndicatorCounted();
   double Total;
//----
   if(Bars<=TPeriodMA) return(0);
//---- initial zero
   if(counted_bars<1)
      for(i=1;i<=TPeriodMA;i++) TBuffer[Bars-i]=0.0;
//----

   i=Bars-TPeriodMA-1;
   if(counted_bars>=TPeriodMA) i=Bars-counted_bars-1;
   while(i>=0)
     {
      Total=0;
      x=0;
      while (x < TPeriodMA)
       {Total=Total + Close[i+x];
        x=x+1;
        }
        Total= Total / TPeriodMA; //Calculates Simple MA for TPeriod for Current Bar

      x=0;
      cnt=0;
      while(x < TPeriodL+1)
      {if(High[i+x] > Total && Low[i+x] < Total) cnt= cnt+1;
       x=x+1;
       }

      TBuffer[i] = cnt;
      HorizBuffer[i] = TPeriodL/2;
      AvgBuffer[i] = (TBuffer[i] + TBuffer[i+1])/2;
      i--;
     }
 return(0);
  }
//+------------------------------------------------------------------+
Comments