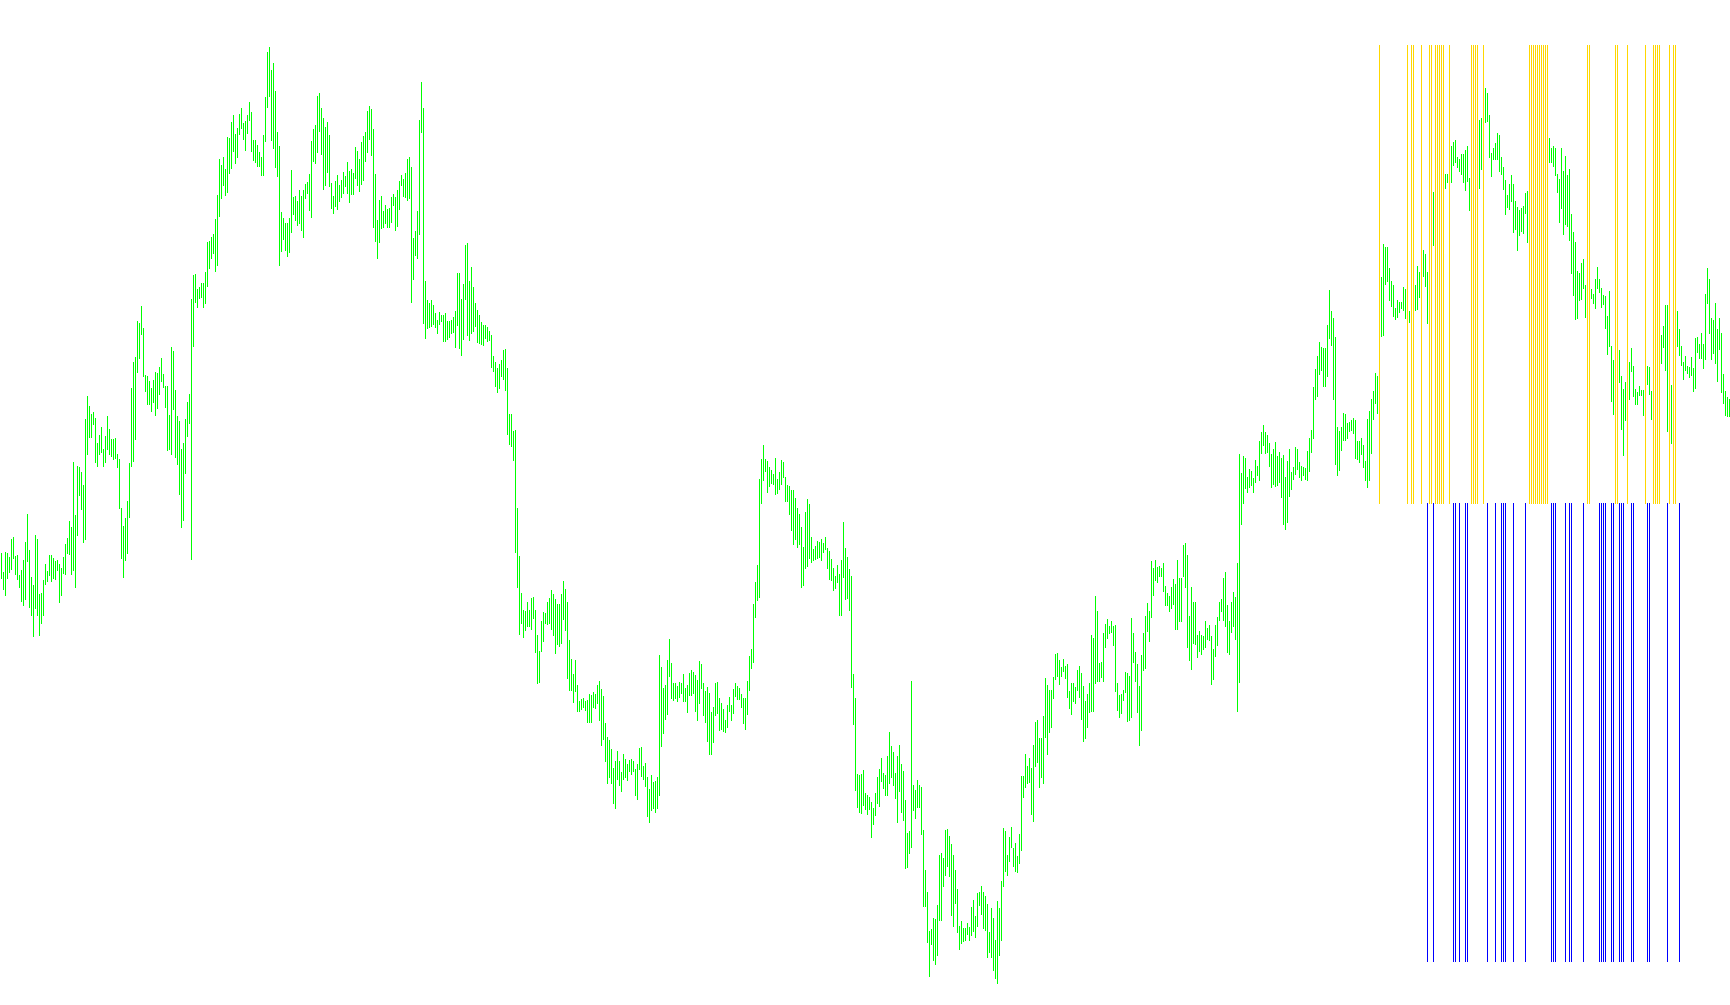
This script functions as a specialized analytical tool designed to simulate and evaluate potential trading outcomes based on historical price movements. Instead of simply reacting to current market prices, it performs a "look-back" analysis to determine the viability of specific trade setups.
Core Operational Logic
1. Data Gathering and Scope The tool examines a large set of historical data (defined as the training sample) to identify patterns. It focuses on specific timeframes and looks at price action over a predetermined "future window." This allows the script to see what happened after a specific point in time to decide if a trade entered at that moment would have been successful.
2. The Simulation Process Every time a new candle forms on a 1-minute chart, the script initiates a comprehensive scanning process. It moves backward through the historical data and performs the following for every price point:
- Entry Identification: It calculates potential "Buy" and "Sell" entry prices based on the closing prices of the historical candles.
- Safety Check (Stop Loss): It checks the recent history to see if the price moved against the position by a set amount (the Stop Loss). If the price hit this "danger zone" first, the trade is flagged as invalid.
- Success Check (Take Profit): Simultaneously, it looks forward into the future window to see if the price reached the desired profit target (the Take Profit) before hitting the Stop Loss.
3. Classification of Results The logic categorizes every historical point into one of three results:
- Successful Buy: If the simulation shows the price hit the profit target without hitting the stop loss, it is marked as a positive outcome.
- Successful Sell: If the simulation shows the price hit the profit target in the downward direction without hitting the stop loss, it is marked as a negative outcome.
- Neutral/Invalid: If the trade hit the stop loss, or if neither the profit target nor the stop loss was reached within the designated window, the result is recorded as neutral (zero).
Visual Output
The script translates these mathematical results into visual indicators on your chart:
- It uses Histograms to represent successful "Buy" and "Sell" outcomes.
- These visual markers serve as a historical map, showing you where specific price actions would have yielded profitable trades versus where they would have resulted in losses or neutral movements.
In essence, the script acts as an automated back-testing engine that constantly re-evaluates past data to illustrate the probability of success for various trade entries based on your specific risk/reward parameters.
//+------------------------------------------------------------------+
//|                                                  Train_04_01.mq4 |
//|                      Copyright © 2008, MetaQuotes Software Corp. |
//|                                        http://www.metaquotes.net |
//+------------------------------------------------------------------+
#property copyright "Copyright © 2008, MetaQuotes Software Corp."
#property link      "http://www.metaquotes.net"

#define NR_OF_SAMPLE_LINES   2000
#define NR_OF_TEST_LINES     800
#define NR_OF_TEST_BARS      10
#define FUTURE_WINDOW        200

#property indicator_separate_window
#property indicator_buffers 4
#property indicator_color1 Blue
#property indicator_color2 Red
#property indicator_color3 Lime
#property indicator_color4 Magenta

extern int TrainPeriod=PERIOD_M5;
extern int StopLoss=70;		//70
extern int TakeProfit=70;	//70

int NrTrainBars=NR_OF_SAMPLE_LINES;
int NrTestBars=NR_OF_TEST_LINES;
int FutureWindow=FUTURE_WINDOW;
int c;
double Buffer1[];
double Buffer2[];
double Buffer3[];
double Buffer4[];

//+------------------------------------------------------------------+
//|                                                                  |
//+------------------------------------------------------------------+
int myBars1;

bool isNewBar1(int tf1)
  {
//----
   bool res=false;
   if (myBars1!=iBars(Symbol(),tf1))
   {
      res=true;
      myBars1=iBars(Symbol(),tf1);
   }

//----
   return(res);
  }
//+------------------------------------------------------------------+
//| Custom indicator initialization function                         |
//+------------------------------------------------------------------+
int init()
  {
//---- indicators
//---- 3 indicator buffers mapping
   SetIndexBuffer(0,Buffer1);
   SetIndexBuffer(1,Buffer2);
   SetIndexBuffer(2,Buffer3);
   SetIndexBuffer(4,Buffer4);
//---- drawing settings
   SetIndexStyle(0,DRAW_HISTOGRAM);
   SetIndexStyle(1,DRAW_HISTOGRAM);
   SetIndexStyle(2,DRAW_LINE);
   SetIndexStyle(3,DRAW_LINE);

   SetIndexEmptyValue(0,EMPTY_VALUE);
   SetIndexEmptyValue(1,EMPTY_VALUE);
   SetIndexEmptyValue(2,EMPTY_VALUE);
   SetIndexEmptyValue(3,EMPTY_VALUE);
//----
   return(0);
  }
//+------------------------------------------------------------------+
//| Custom indicator deinitialization function                       |
//+------------------------------------------------------------------+
int deinit()
  {
//----

//----
   return(0);
  }
//+------------------------------------------------------------------+
//| Custom indicator iteration function                              |
//+------------------------------------------------------------------+

int start()
  {
   int limit;

   int counted_bars=IndicatorCounted();
//---- check for possible errors
   if(counted_bars<0) return(-1);
//---- last counted bar will be recounted
   if(counted_bars>0) counted_bars--;
   limit=Bars-counted_bars;
//---- main loop


if(isNewBar1(PERIOD_M1))
{


   int spread=MarketInfo(Symbol(),MODE_SPREAD);
   double Point1=MarketInfo(Symbol(),MODE_POINT);
   double sp=spread*Point;
   double entry_buy;//entry_buy=bid0+sp
   double entry_sell;//entry_sell=bid0
   bool longOk;
   bool shortOk;
   int FW=FutureWindow;
   int i,j,fw;
   double l,h;

   datetime t1=iTime(Symbol(),TrainPeriod,FW);
   int FW2=iBarShift(Symbol(),0,t1,true);

   datetime t2=iTime(Symbol(),TrainPeriod,NrTrainBars);
   int NrTrainBars2=iBarShift(Symbol(),0,t2,true);

	  for(i=FW2,j=0;j<NrTrainBars2;i++,j++)
      //for ( i=nr_of_sample_lines-1; i>=0; i--)
	  {
        c=-2;
        datetime time1=iTime(Symbol(),0,i);
        int ii=iBarShift(Symbol(),TrainPeriod,time1,true);
        entry_buy = iClose(Symbol(),TrainPeriod,ii)+sp;//entry_buy=bid0+sp
        entry_sell = iClose(Symbol(),TrainPeriod,ii);//entry_sell=bid0
        longOk=true;
        shortOk=true;
        for (fw=0; fw<FW; fw++)
        {
          l=iLow(Symbol(),TrainPeriod,ii-fw);
          h=iHigh(Symbol(),TrainPeriod,ii-fw);
          if (l<=entry_buy-StopLoss*Point) longOk=false;
          if (h+sp>=entry_sell+StopLoss*Point) shortOk=false;
          if (longOk && (h>=entry_buy+TakeProfit*Point)) { c=+1;  break; }
          if (shortOk && (l+sp<=entry_sell-TakeProfit*Point)) { c=-1;  break; }
        }
        if(c != -2)
          if(c>0)
            Buffer1[i]=c;
          else
            Buffer2[i]=c;
        else
        {
          Buffer1[i]=0;
          Buffer2[i]=0;
        }
    }
/*
   //for( i=0; i<limit; i++)
   for(i=FUTURE_WINDOW ;i<NR_OF_SAMPLE_LINES;i++)
   {

       Buffer1[i]=Close[i];


     //if(svm_samples_class_dyn_1[i]==-1)
     //  Buffer2[i]=-1;

   }
*/
/*
   for(i=0;i<NR_OF_TEST_LINES;i++)
   {
     if(ptr_predict_label_1[i]==1)
       Buffer3[i]=1.1;


     if(ptr_predict_label_1[i]==-1)
        Buffer4[i]=-1.1;

   }
*/

}


//----
   return(0);
  }
//+------------------------------------------------------------------+
Comments