T3 TRIX
Download script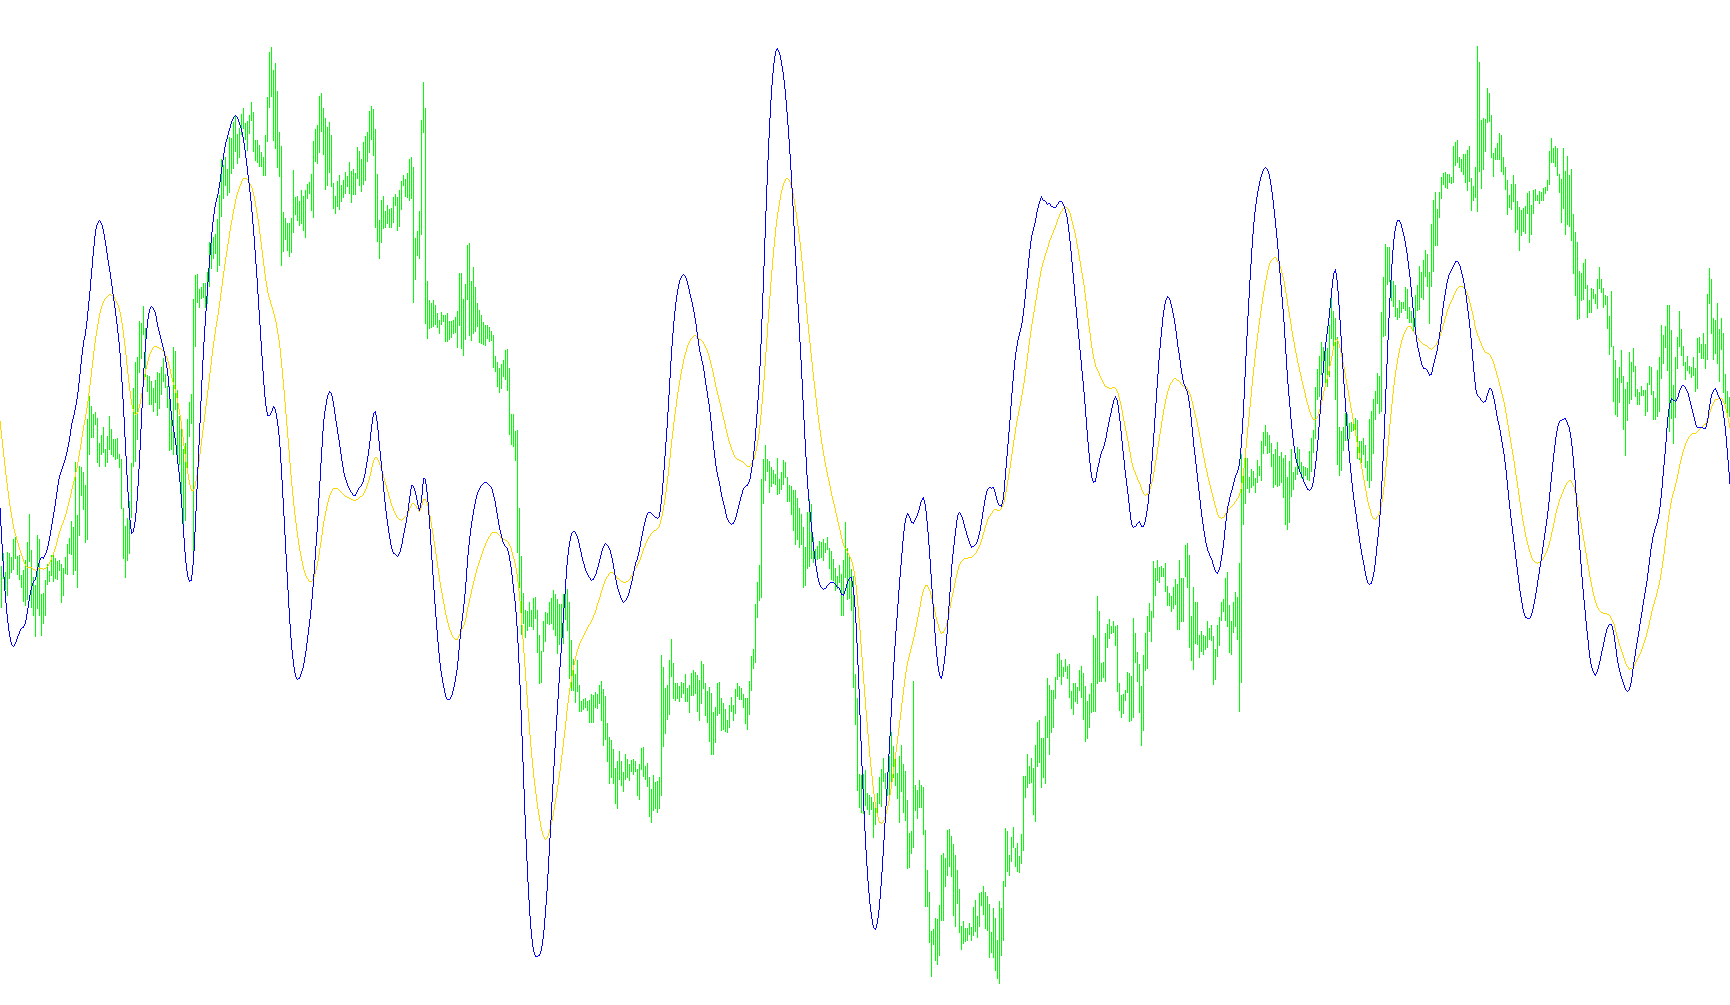
This script is a technical analysis tool designed for the MetaTrader platform to help traders visualize price momentum and trends. It utilizes a specialized smoothing logic (known as T3) to filter out market noise, providing a clearer picture of price movement than standard moving averages.
Core Methodology
The tool processes price data using two distinct layers of calculation:
1. Double Smoothing Mechanism Instead of simply averaging prices over a set period, the script employs a sophisticated smoothing technique. It calculates weights based on user-defined periods (A and B) and a "hot" factor. This allows the indicator to remain responsive to new price changes while maintaining a smooth curve that ignores minor fluctuations or "jitter" in the market.
2. Dual Momentum Tracking The script creates two separate visual components (represented as different colored lines on your chart):
- Line A: Tracks the trend based on one set of time parameters.
- Line B: Tracks the trend based on a second, independent set of time parameters.
By calculating these two trends simultaneously, the tool allows traders to see how different "timeframes" or "sensitivities" are reacting to the current market price.
Data Calculation Logic
The script follows a systematic step-by-step process for every price bar:
- Weighted Accumulation: It takes the current price (either the opening or closing price, depending on your settings) and blends it with previous values.
- Multi-Stage Processing: The data passes through six sequential stages of calculation. This deepening of the math ensures that the final result is a highly refined representation of the trend.
- Percentage Change: Rather than showing the raw price, the indicator calculates the percentage difference between the current trend value and its previous value. This translates "price movement" into "rate of change," making it easier to identify accelerating or decelerating momentum.
Key Functional Features
- Customizable Sensitivity: You can adjust the periods for both Trend A and Trend B, allowing you to switch from a "fast" reactive view to a "slow" long-term trend view.
- Price Source Selection: The logic includes an option to calculate trends based on either the Opening Price or the Closing Price of a candle.
- Differential Mode: There is a specific setting that allows you to toggle how the two lines are displayed—either showing them as independent signals or combining their movements into a single comparative view.
Summary for the Trader
In essence, this script acts as a sophisticated "momentum filter." It takes raw market data and smooths it twice to create two distinct trend lines. By watching these lines, traders can identify not just where the price is going, but how much speed or strength is behind that movement across different time horizons.
//+------------------------------------------------------------------+
//|                                                      T3 TRIX.mq4 |
//|                                                                  |
//|                                                                  |
//+------------------------------------------------------------------+
#property copyright "convert FinGeR Alex orginal by Luis Damiani"

#property indicator_separate_window
#property indicator_buffers 2
#property indicator_color1 DeepSkyBlue
#property indicator_color2 Lime
//---- input parameters
extern int       A_t3_period=50;
extern int       num_bars=1500;
extern int       is_A_open_price=0;
extern int       B_t3_period_ac=34;
extern int       diferential=0;
extern double    hot=0.7;
//---- buffers
double ExtMapBuffer1[];
double ExtMapBuffer2[];
//+------------------------------------------------------------------+
//| Custom indicator initialization function                         |
//+------------------------------------------------------------------+
int init()
  {
//---- indicators
   SetIndexStyle(0,DRAW_LINE);
   SetIndexBuffer(0,ExtMapBuffer1);
   SetIndexStyle(1,DRAW_LINE);
   SetIndexBuffer(1,ExtMapBuffer2);
//----
   return(0);
  }
//+------------------------------------------------------------------+
//| Custor indicator deinitialization function                       |
//+------------------------------------------------------------------+
int deinit()
  {
//----

//----
   return(0);
  }
//+------------------------------------------------------------------+
//| Custom indicator iteration function                              |
//+------------------------------------------------------------------+
int start()
  {

int  shift=0;
double A_t3=0,A_t3_1=0,max_per=0;
double  B_t3=0,B_t3_1=0;
double e1=0,e2=0,e3=0,e4=0,e5=0,e6=0,c1=0,c2=0,c3=0,c4=0;
double e1x=0,e2x=0,e3x=0,e4x=0,e5x=0,e6x=0;
double d1=0,d2=0,d3=0,d4=0,d5=0,d6=0;
double d1x=0,d2x=0,d3x=0,d4x=0,d5x=0,d6x=0;
double n=0,A_w1=0,A_w2=0,B_w1=0,B_w2=0,b2=0,b3=0;
double init=true;
double bar=0, prevbars=0, start=0, cs=0, prevcs=0,frame=0;
string commodt="nonono";
int    counted_bars=IndicatorCounted();

cs = num_bars+A_t3_period+is_A_open_price+B_t3_period_ac+diferential+hot;

if (cs==prevcs && commodt==Symbol() && frame==Time[4]-Time[5] && Bars-prevbars<2)
start=Bars-prevbars;
else start=-1;
commodt=Symbol();
frame=Time[4]-Time[5];
prevbars = Bars;
prevcs = cs;

if (start==1 || start==0)  bar=start; else init=true;

if (init==true)
{
  b2=hot*hot;
  b3=b2*hot;
  c1=-b3;
  c2=(3*(b2+b3));
  c3=-3*(2*b2+hot+b3);
  c4=(1+3*hot+b3+3*b2);

  n=A_t3_period;

  if (n<1) n=1;

  n = 1 + 0.5*(n-1);
  A_w1 = 2 / (n + 1);
  A_w2 = 1 - A_w1;

 n=B_t3_period_ac;

  if (n<1) n=1;
  n = 1 + 0.5*(n-1);
  B_w1 = 2 / (n + 1);
  B_w2 = 1 - B_w1;

ExtMapBuffer1[num_bars-1]=0;


e1x=0;e2x=0;e3x=0;e4x=0;e5x=0;e6x=0;

ExtMapBuffer2[num_bars-1]=0;

d1x=0;d2x=0;d3x=0;d4x=0;d5x=0;d6x=0;

// max_per=max(A_t3_period,B_t3_period_ac);
bar=num_bars-2;
init=false;
}


//SetLoopCount(0);
shift=bar;

while(shift>=0)

{

 if ( is_A_open_price==1 ) d1 = A_w1*Open[shift] + A_w2*d1x;
  else d1 = A_w1*Close[shift] + A_w2*d1x;
  d2 = A_w1*d1 + A_w2*d2x;
  d3 = A_w1*d2 + A_w2*d3x;
  d4 = A_w1*d3 + A_w2*d4x;
  d5 = A_w1*d4 + A_w2*d5x;
  d6 = A_w1*d5 + A_w2*d6x;

  A_t3 = c1*d6 + c2*d5 + c3*d4 + c4*d3;


if ((start==1 && shift==1) || start==-1  )
{

  d1x=d1;
  d2x=d2;
  d3x=d3;
  d4x=d4;
  d5x=d5;
  d6x=d6;
  }
  e1 = B_w1*Close[shift] + B_w2*e1x;
  e2 = B_w1*e1 + B_w2*e2x;
  e3 = B_w1*e2 + B_w2*e3x;
  e4 = B_w1*e3 + B_w2*e4x;
  e5 = B_w1*e4 + B_w2*e5x;
  e6 = B_w1*e5 + B_w2*e6x;
B_t3 = c1*e6 + c2*e5 + c3*e4 + c4*e3;

  if(diferential==1)
  {

   ExtMapBuffer1[shift]=(A_t3-A_t3_1)/A_t3_1;
   ExtMapBuffer2[shift]=(A_t3-A_t3_1)/A_t3_1+(B_t3-B_t3_1)/B_t3_1;


  }
  else
  {

if ( B_t3_1 >0 && A_t3_1>0) {
ExtMapBuffer2[shift]=(B_t3-B_t3_1)/B_t3_1;
ExtMapBuffer1[shift]=(A_t3-A_t3_1)/A_t3_1;
}
  //Comment("0");

  }

 //Comment("  start: ",start,"  bar: ",bar,"\n",
//"frame: ",frame,"  num_bars:" ,num_bars," commodity: ",commodt ,"\n",(B_t3-B_t3_1)/B_t3_1);

if ((start==1 && shift==1) || start==-1)
{
//Comment("Bar=ghfghfgh");
  A_t3_1=A_t3;
  B_t3_1=B_t3;
  e1x=e1;
  e2x=e2;
  e3x=e3;
  e4x=e4;
  e5x=e5;
  e6x=e6;

 }

  shift--;
//Comment("View !!!  NO?????");
   }
//----


  }
//+------------------------------------------------------------------+
Comments