T3 TRIX THV
Download script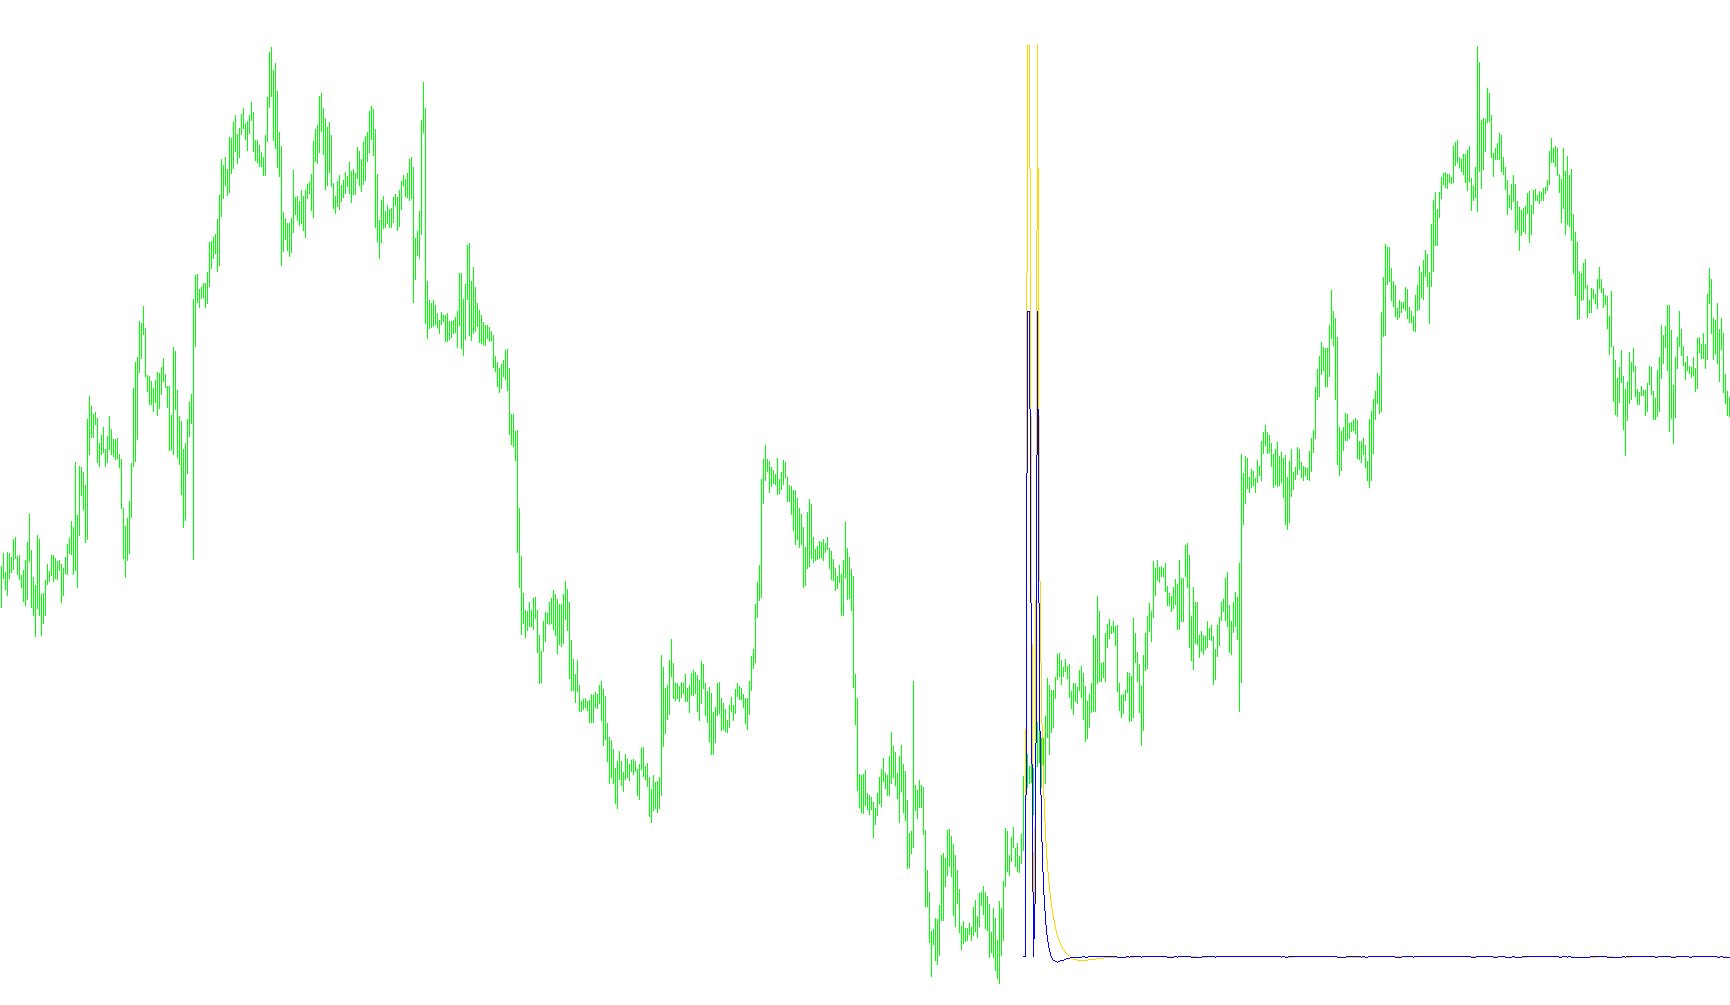
This script functions as a specialized technical analysis tool designed to track and visualize price momentum and velocity within a trading chart. It operates by calculating complex, smoothed moving averages and then determining the "Rate of Change" (the speed at which those averages are moving) rather than just showing the price itself.
Core Logic Overview
The indicator processes market data through three distinct layers of calculation:
1. Smoothing and Filtering Instead of reacting instantly to every minor price tick, the script uses a specialized smoothing technique. It takes raw price data (either opening or closing prices, depending on your settings) and applies a weighted calculation across multiple consecutive periods. This helps filter out "market noise" and identifies the underlying trend.
2. The T3 Calculation Engine The script utilizes a logic based on the "T3" moving average methodology. It doesn't just look at the last few bars; it performs a series of recursive calculations (passing the results of one calculation into the next six times). By doing this, it creates a very smooth curve that remains highly responsive to trend changes without the typical "lag" found in standard moving averages.
3. Momentum and Velocity Analysis (Rate of Change) The unique purpose of this specific script is what it does with those smooth curves. It calculates the difference between the current smoothed value and the previous smoothed value.
- It then converts this difference into a percentage.
- This essentially tells you how fast the price is accelerating or decelerating.
Visual Representation
The indicator produces two distinct lines on your chart:
- Primary Line: Represents the momentum of the first primary trend period (A_t3).
- Secondary Line: Depending on your settings, this represents a secondary momentum calculation (B_t3) or a combined total of both momentum sets.
Summary for the Trader
In practical terms, this tool is designed to help you see velocity. While most indicators tell you "where the price is," this script helps you see "how fast the price is moving in a specific direction." When the lines move sharply upward, it indicates strong bullish acceleration; when they flatten out or drop, it suggests the trend is losing momentum, potentially signaling a cooling-off period or a trend reversal.
/*-----------------------------+
|			       |
| Shared by www.Aptrafx.com    |
|			       |
+------------------------------*/

//+------------------------------------------------------------------+
//|                                          T3 TRIX (ROC of T6).mq4 |
//|                      convert FinGeR Alex orginal by Luis Damiani |
//|     Modified by Cobraforex for THV System, www.cobraforex.com    |
//+------------------------------------------------------------------+
#property copyright "convert FinGeR Alex orginal by Luis Damiani"
#property link      ""

#property indicator_separate_window
#property indicator_buffers 2
#property indicator_color1 FireBrick
#property indicator_color2 Green
//---- input parameters
extern int       A_t3_period=18;
extern int       num_bars=350;
extern int       is_A_open_price=0;
extern int       B_t3_period_ac=8;
extern int       diferential=0;
extern double    hot=0.7;
//---- buffers
double ExtMapBuffer1[];
double ExtMapBuffer2[];
//+------------------------------------------------------------------+
//| Custom indicator initialization function                         |
//+------------------------------------------------------------------+
int init()
  {
//---- indicators
   SetIndexStyle(0,DRAW_LINE);
   SetIndexBuffer(0,ExtMapBuffer1);
   SetIndexStyle(2,DRAW_LINE);
   SetIndexBuffer(1,ExtMapBuffer2);
//----
   return(0);
  }
//+------------------------------------------------------------------+
//| Custor indicator deinitialization function                       |
//+------------------------------------------------------------------+
int deinit()
  {
//----

//----
   return(0);
  }
//+------------------------------------------------------------------+
//| Custom indicator iteration function                              |
//+------------------------------------------------------------------+
int start()
  {

int  shift=0;
double A_t3=0,A_t3_1=0,max_per=0;
double  B_t3=0,B_t3_1=0;
double e1=0,e2=0,e3=0,e4=0,e5=0,e6=0,c1=0,c2=0,c3=0,c4=0;
double e1x=0,e2x=0,e3x=0,e4x=0,e5x=0,e6x=0;
double d1=0,d2=0,d3=0,d4=0,d5=0,d6=0;
double d1x=0,d2x=0,d3x=0,d4x=0,d5x=0,d6x=0;
double n=0,A_w1=0,A_w2=0,B_w1=0,B_w2=0,b2=0,b3=0;
double init=true;
double bar=0, prevbars=0, start=0, cs=0, prevcs=0,frame=0;
string commodt="nonono";
int    counted_bars=IndicatorCounted();

cs = num_bars+A_t3_period+is_A_open_price+B_t3_period_ac+diferential+hot;

if (cs==prevcs && commodt==Symbol() && frame==Time[4]-Time[5] && Bars-prevbars<2)
start=Bars-prevbars;
else start=-1;
commodt=Symbol();
frame=Time[4]-Time[5];
prevbars = Bars;
prevcs = cs;

if (start==1 || start==0)  bar=start; else init=true;

if (init==true)
{
  b2=hot*hot;
  b3=b2*hot;
  c1=-b3;
  c2=(3*(b2+b3));
  c3=-3*(2*b2+hot+b3);
  c4=(1+3*hot+b3+3*b2);

  n=A_t3_period;

  if (n<1) n=1;

  n = 1 + 0.5*(n-1);
  A_w1 = 2 / (n + 1);
  A_w2 = 1 - A_w1;

 n=B_t3_period_ac;

  if (n<1) n=1;
  n = 1 + 0.5*(n-1);
  B_w1 = 2 / (n + 1);
  B_w2 = 1 - B_w1;

ExtMapBuffer1[num_bars-1]=0;


e1x=0;e2x=0;e3x=0;e4x=0;e5x=0;e6x=0;

ExtMapBuffer2[num_bars-1]=0;

d1x=0;d2x=0;d3x=0;d4x=0;d5x=0;d6x=0;

// max_per=max(A_t3_period,B_t3_period_ac);
bar=num_bars-2;
init=false;
}


//SetLoopCount(0);
shift=bar;

while(shift>=0)

{

 if ( is_A_open_price==1 ) d1 = A_w1*Open[shift] + A_w2*d1x;
  else d1 = A_w1*Close[shift] + A_w2*d1x;
  d2 = A_w1*d1 + A_w2*d2x;
  d3 = A_w1*d2 + A_w2*d3x;
  d4 = A_w1*d3 + A_w2*d4x;
  d5 = A_w1*d4 + A_w2*d5x;
  d6 = A_w1*d5 + A_w2*d6x;

  A_t3 = c1*d6 + c2*d5 + c3*d4 + c4*d3;


if ((start==1 && shift==1) || start==-1  )
{

  d1x=d1;
  d2x=d2;
  d3x=d3;
  d4x=d4;
  d5x=d5;
  d6x=d6;
  }
  e1 = B_w1*Close[shift] + B_w2*e1x;
  e2 = B_w1*e1 + B_w2*e2x;
  e3 = B_w1*e2 + B_w2*e3x;
  e4 = B_w1*e3 + B_w2*e4x;
  e5 = B_w1*e4 + B_w2*e5x;
  e6 = B_w1*e5 + B_w2*e6x;
B_t3 = c1*e6 + c2*e5 + c3*e4 + c4*e3;

  if(diferential==1)
  {

   ExtMapBuffer1[shift]=(A_t3-A_t3_1)/A_t3_1;
   ExtMapBuffer2[shift]=(A_t3-A_t3_1)/A_t3_1+(B_t3-B_t3_1)/B_t3_1;


  }
  else
  {

if ( B_t3_1 >0 && A_t3_1>0) {
ExtMapBuffer2[shift]=(B_t3-B_t3_1)/B_t3_1;
ExtMapBuffer1[shift]=(A_t3-A_t3_1)/A_t3_1;
}
  //Comment("0");

  }

 //Comment("  start: ",start,"  bar: ",bar,"\n",
//"frame: ",frame,"  num_bars:" ,num_bars," commodity: ",commodt ,"\n",(B_t3-B_t3_1)/B_t3_1);

if ((start==1 && shift==1) || start==-1)
{
//Comment("Bar=ghfghfgh");
  A_t3_1=A_t3;
  B_t3_1=B_t3;
  e1x=e1;
  e2x=e2;
  e3x=e3;
  e4x=e4;
  e5x=e5;
  e6x=e6;

 }

  shift--;
//Comment("View !!!  NO?????");
   }
//----


  }
//+------------------------------------------------------------------+
Comments