Stodiv_v2
Download script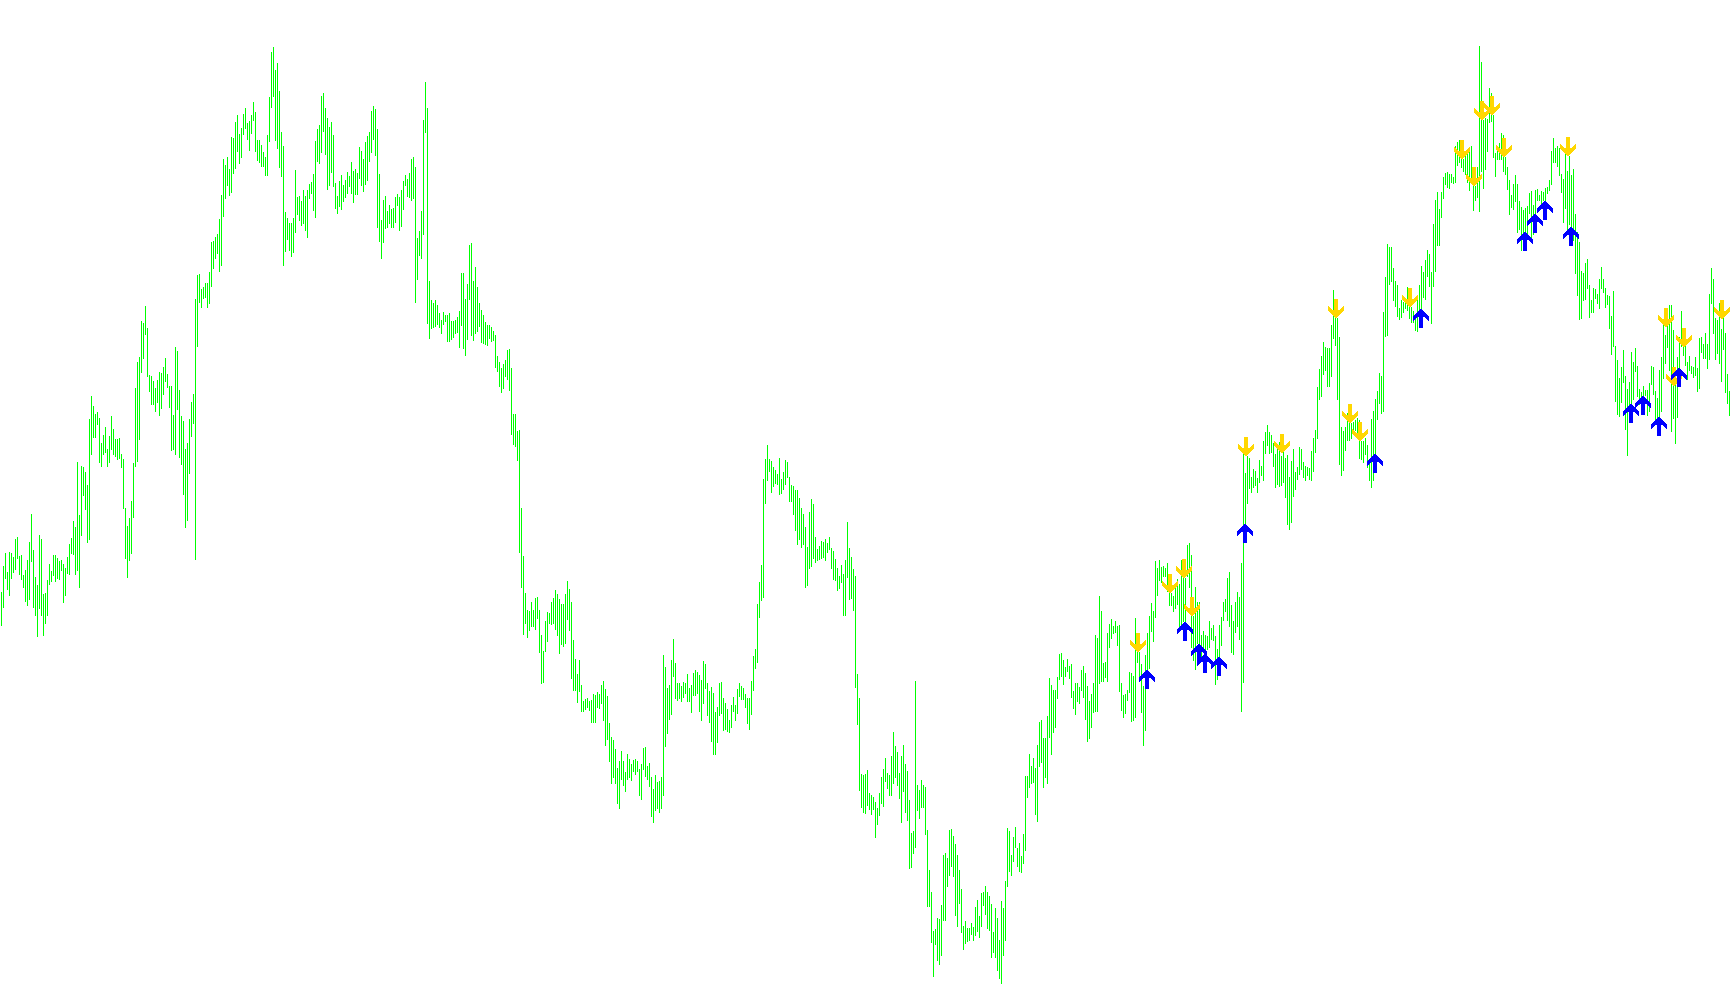
This script is a technical analysis tool designed to identify specific trend reversal points on a financial chart by combining two different types of market indicators: Fractals and the Stochastic Oscillator. Instead of simply looking at price movement, it filters out "noise" to find high-probability areas where the market might be changing direction.
How the Logic Works
The script operates by scanning historical price data to identify specific patterns based on the following criteria:
1. Identifying Structural Peaks and Valleys (Fractals)
First, the script looks for "Fractals," which are essentially local high points or low points in the price action. It identifies these by checking if a specific candle's peak is higher (or lower) than the candles surrounding it. This helps the tool establish the general "skeleton" of the market's movement.
2. Measuring Significant Price Shifts
The logic doesn't just look for any peak; it looks for significant ones. It compares a current fractal point to previous ones within a specific window of time. It only proceeds if the price jump between these two points exceeds a user-defined threshold (a vertical distance). This ensures that the script ignores minor fluctuations and focuses on meaningful price movements.
3. Verifying with Momentum (Stochastic Oscillator)
To prevent false signals, the script adds a secondary "momentum" check using the Stochastic Oscillator. Once a significant price peak or valley is found, the tool looks at the oscillator's values:
- For Bearish Signals (Top): If a new high point is found but the momentum (Stochastic) is actually moving downward compared to the previous point, it suggests that the upward "push" is exhausting. The script then places a crimson arrow above the price.
- For Bullish Signals (Bottom): If a new low point is found but the momentum is moving upward compared to the previous point, it suggests that the downward "selling pressure" is fading. The script then places a blue arrow below the price.
Summary of Visual Output
The end result for the user is a visual set of arrows on the chart:
- Crimson Arrows: Signal potential売り (sell) opportunities where a significant high has formed but momentum is beginning to wane.
- DodgerBlue Arrows: Signal potential買い (buy) opportunities where a significant low has formed but momentum is beginning to turn positive.
By requiring both a structural price move and a momentum confirmation, the script aims to provide a more refined entry signal than using either indicator alone.
//+------------------------------------------------------------------+
//|                                                       Stodiv.mq4 |
//|                      Copyright © 2007, MetaQuotes Software Corp. |
//|                                        http://www.metaquotes.net |
//+------------------------------------------------------------------+
#property copyright "Copyright © 2005-2006, RickD"
#property link      "http://e2e-fx.net"
//----
#property indicator_chart_window
#property indicator_buffers 2
//----
#property indicator_color1 Crimson
#property indicator_color2 DodgerBlue
//----
extern int MaxBars=300;
extern int dx=30;
extern int dy=20;
extern int KPeriod=5;
extern int DPeriod=3;
extern int Slowing=3;
//----
double buf1[];
double buf2[];
//+------------------------------------------------------------------+
//|                                                                  |
//+------------------------------------------------------------------+
  void init()
  {
   SetIndexBuffer(0, buf1);
   SetIndexBuffer(1, buf2);
   //
   SetIndexStyle(0, DRAW_ARROW, EMPTY, 2);
   SetIndexArrow(0, 234);
   //
   SetIndexStyle(1, DRAW_ARROW, EMPTY, 2);
   SetIndexArrow(1, 233);
  }
//+------------------------------------------------------------------+
//|                                                                  |
//+------------------------------------------------------------------+
  void start()
  {
   double fr0, fr1;
   double sto0, sto1;
//----
   int counted=IndicatorCounted();
   if (counted < 0) return(-1);
   if (counted > 0) counted--;
   int limit=Bars-counted;
   limit=MathMin(limit, Bars-dx);
   limit=MathMin(limit, MaxBars);
     for(int i=0; i < limit; i++)
     {
      buf1[i]=0;
      fr0=iFractals(NULL, 0, MODE_UPPER, i+2);
      if (fr0==0) continue;
        for(int j=i+1; j < i+dx; j++)
        {
         fr1=iFractals(NULL, 0, MODE_UPPER, j+2);
         if (fr1==0) continue;
           if (fr0 > fr1+dy*Point)
           {
            sto0=iStochastic(NULL, 0, KPeriod, DPeriod, Slowing, MODE_SMA, 0, MODE_MAIN, i+2);
            sto1=iStochastic(NULL, 0, KPeriod, DPeriod, Slowing, MODE_SMA, 0, MODE_MAIN, j+2);
              if (sto0 < sto1)
              {
               buf1[i]=High[i] + 20*Point;
               break;
              }
           }
        }
     }
     for(i=0; i < limit; i++)
     {
      buf2[i]=0;
      fr0=iFractals(NULL, 0, MODE_LOWER, i+2);
      if (fr0==0) continue;
        for(j=i+1; j < i+dx; j++)
        {
         fr1=iFractals(NULL, 0, MODE_LOWER, j+2);
         if (fr1==0) continue;
           if (fr0 < fr1-dy*Point)
           {
            sto0=iStochastic(NULL, 0, KPeriod, DPeriod, Slowing, MODE_SMA, 0, MODE_MAIN, i+2);
            sto1=iStochastic(NULL, 0, KPeriod, DPeriod, Slowing, MODE_SMA, 0, MODE_MAIN, j+2);
              if (sto0 > sto1)
              {
               buf2[i]=Low[i] - 20*Point;
               break;
              }
           }
        }
     }
  }
//+------------------------------------------------------------------+
Comments