STARC Bands
Download script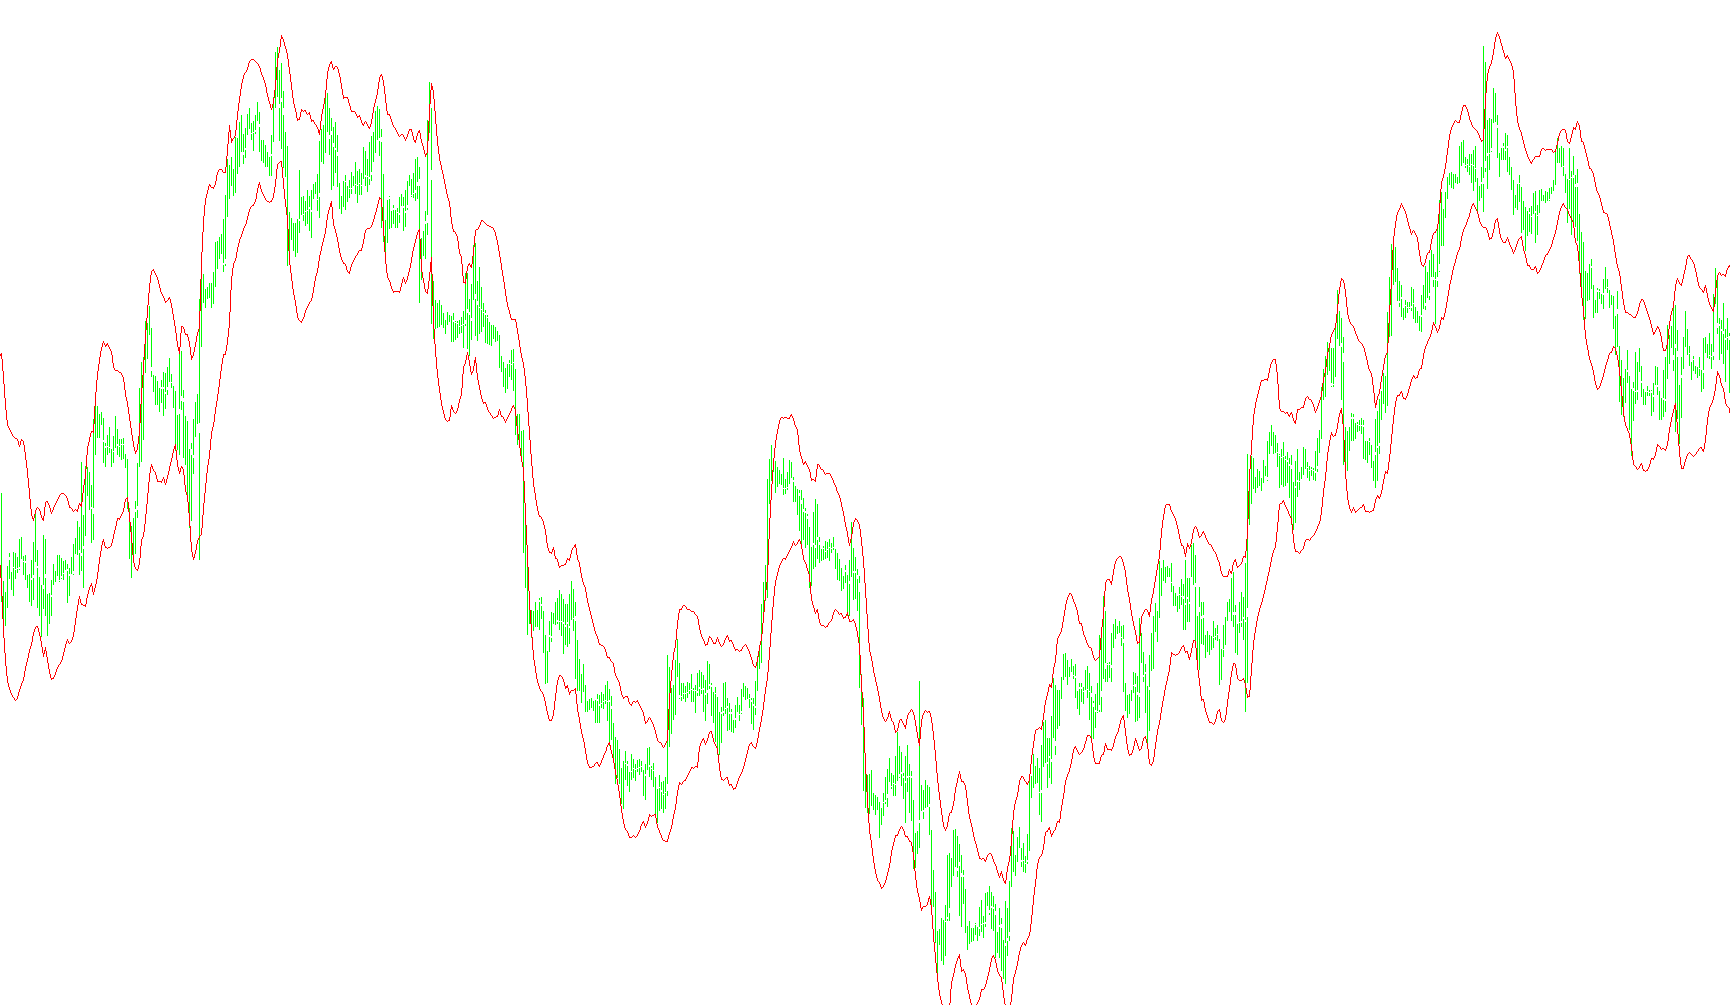
This tool is designed to provide traders with a visual representation of market volatility and trend direction by plotting three distinct lines on a price chart. It functions as a dynamic "channel," helping users identify the general path of the market while accounting for its natural fluctuations.
Core Logic and Components
The script calculates three specific visual elements that work together to map out the trading environment:
1. The Central Trend Line (Moving Average) At the heart of the indicator is a moving average line. This serves as the "baseline" for the price action. It smooths out minor market "noise" to show the underlying direction. By looking at this center line, a trader can quickly see if the general momentum is trending upward, downward, or moving sideways.
2. The Volatility Bands (Upper and Lower) Surrounding the central trend line are two outer bands—a top and a bottom boundary. These are not fixed lines; instead, they expand and contract based on market volatility.
- When the market is calm and price movements are small, the bands tighten toward the center.
- When the market becomes volatile and prices swing wildly, the bands widen to create a larger "buffer" zone.
How it Works Together
The logic uses a mathematical calculation that takes the current average price and adds or subtracts a specific multiplier of "market movement" (volatility).
Because the bands are tied to volatility, they provide a visual representation of what is considered a "normal" price range for the current market conditions. When the price stays within these bands, it suggests the market is behaving normally. When the price pushes toward or outside of these boundaries, it may signal that the market is experiencing an unusual stretch of movement or a potential trend reversal.
Summary of Visual Output
The result on your chart is a three-line system:
- Middle Line: Shows you the current average trend.
- Upper Band: Represents the high end of expected price action based on recent volatility.
- Lower Band: Represents the low end of expected price action based on recent volatility.
//+------------------------------------------------------------------+
//| STARCBands.mq4                                                   |
//| Copyright © 2005, scorpion@fxfisherman.com                       |
//| http://www.fxfisherman.com/                                      |
//+------------------------------------------------------------------+
#property copyright "Copyright © 2005, scorpion@fxfisherman.com"
#property link "http://www.fxfisherman.com/"

#property indicator_chart_window
#property indicator_buffers 3

//---- indicator parameters
extern int MA_Period=6;
extern int ATR_Period=15;
extern double KATR=2;
extern int Shift=1;
extern color UpperColor=Red;
extern color MiddleColor=White;
extern color LowerColor=Red;

//---- buffers
double MovingBuffer[];
double UpperBuffer[];
double LowerBuffer[];

//+------------------------------------------------------------------+
//| Custom indicator initialization function |
//+------------------------------------------------------------------+
int init()
{
  //---- indicators
  SetIndexStyle(0,DRAW_LINE,0,1,MiddleColor);
  SetIndexBuffer(0,MovingBuffer);
  SetIndexStyle(1,DRAW_LINE,0,1,UpperColor);
  SetIndexBuffer(1,UpperBuffer);
  SetIndexStyle(2,DRAW_LINE,0,1,LowerColor);
  SetIndexBuffer(2,LowerBuffer);
  //----
  SetIndexDrawBegin(0,MA_Period+Shift);
  SetIndexDrawBegin(1,ATR_Period+Shift);
  SetIndexDrawBegin(2,ATR_Period+Shift);
  //----
  return(0);
}

//+------------------------------------------------------------------+
//| Bollinger Bands |
//+------------------------------------------------------------------+
int start()
{
  int i,k,counted_bars=IndicatorCounted();

  //----
  if(Bars<=MA_Period) return(0);

  //---- initial zero
  if(counted_bars<1)
  for(i=1;i<=MA_Period;i++)
  {
    MovingBuffer[Bars-i]=EMPTY_VALUE;
    UpperBuffer[Bars-i]=EMPTY_VALUE;
    LowerBuffer[Bars-i]=EMPTY_VALUE;
  }

  //----
  int limit=Bars-counted_bars;
  if(counted_bars>0) limit++;
  for(i=0; i<limit; i++)
  {
    MovingBuffer[i] = iMA(NULL,0,MA_Period,Shift,MODE_EMA,PRICE_CLOSE,i);
    UpperBuffer[i] = MovingBuffer[i] + (KATR * iATR(NULL,0,ATR_Period,i+Shift));
    LowerBuffer[i] = MovingBuffer[i] - (KATR * iATR(NULL,0,ATR_Period,i+Shift));
  }

  //----
  return(0);
}

//+----------scorpion@fxfisherman.com--------------------------------+
Comments