SilverTrend_Signal With Alert v3e
Download script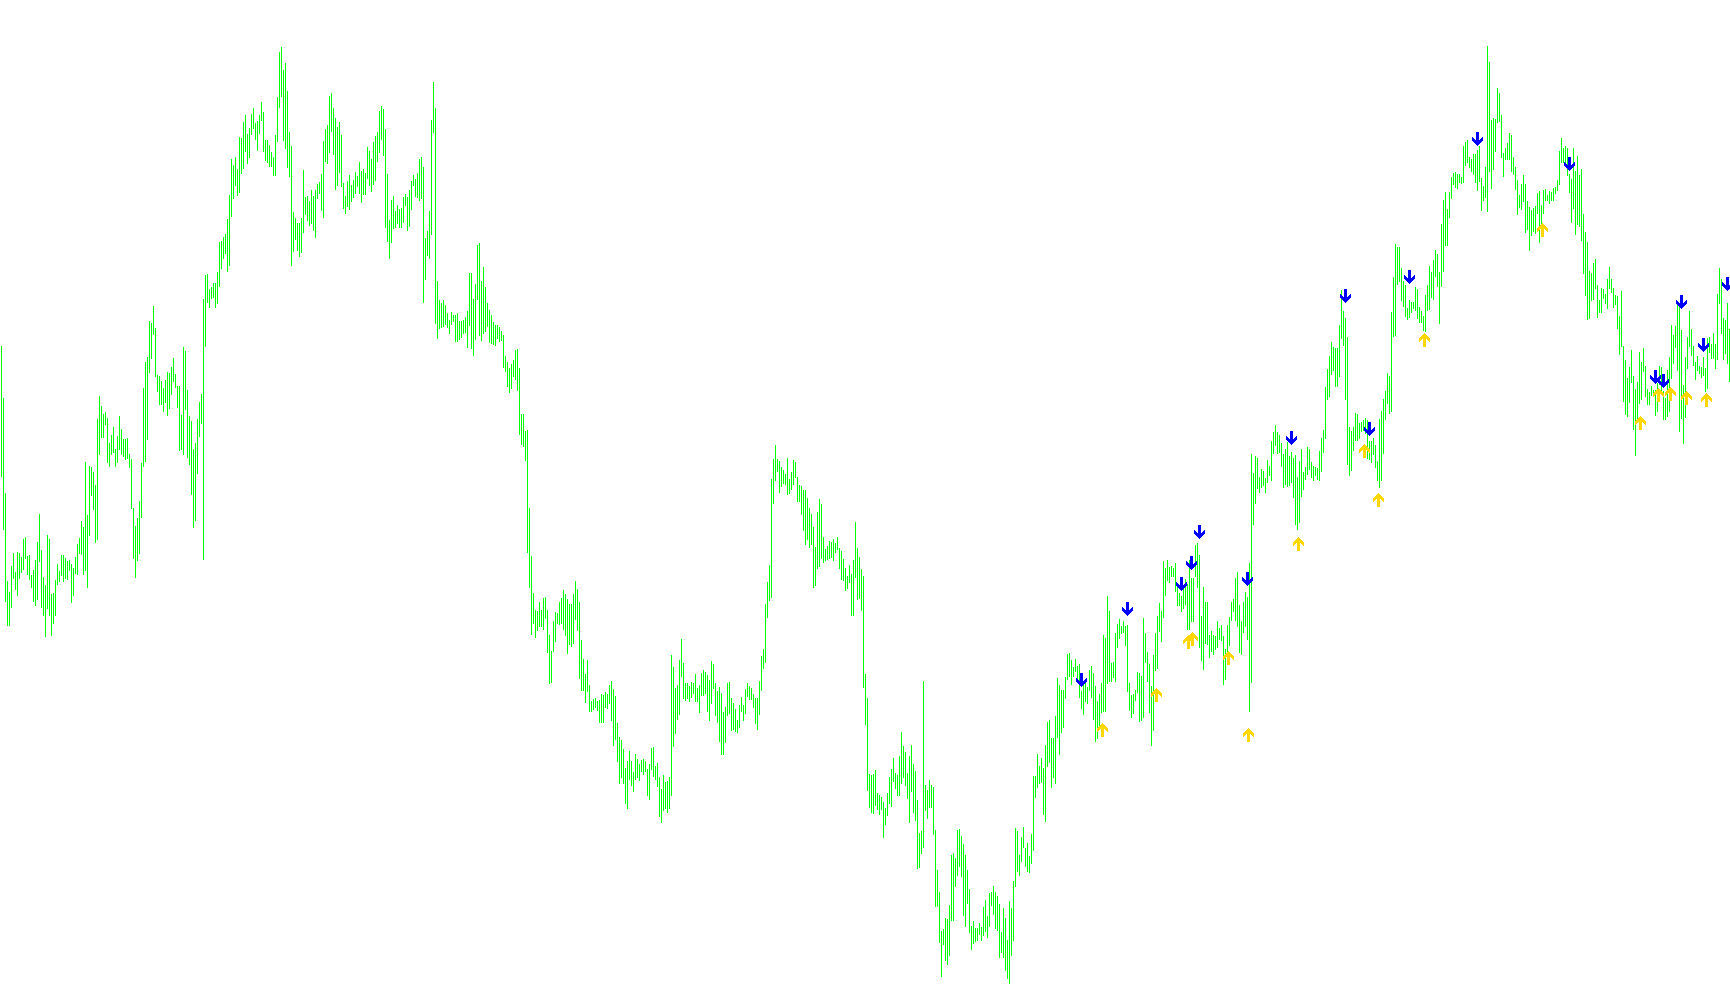
This script functions as a dynamic trend-following indicator designed to identify potential buying and selling opportunities by analyzing price momentum and historical volatility. Instead of simply reacting to every minor price fluctuation, it uses a mathematical framework to determine the "strength" of a current market move relative to its recent history.
How the Logic Works
1. Volatility and Range Assessment The indicator first looks at a specific window of previous candles (defined by the user) to calculate the average range of price movement. By understanding how much the price typically moves in a short period, the script can establish a "normal" baseline for volatility. This helps ensure that signals are based on meaningful movements rather than insignificant noise.
2. Dynamic Support and Resistance Boundaries The core engine identifies the highest highs and lowest lows within its observation window. It then calculates two dynamic price boundaries:
- A Lower Boundary: Calculated based on a percentage of the total range.
- An Upper Boundary: Calculated based on a percentage of the total range.
These boundaries act as invisible "tripwires." The script constantly monitors whether the closing price of a candle breaks above or below these dynamically adjusted levels.
3. Trend Detection and Signal Generation The logic tracks the "state" of the market (Upward vs. Downward). A signal is triggered only when there is a definitive shift in this state:
- Buy Signal: Triggered when the price closes decisively above the Upper Boundary, confirming an upward trend. The script then places a visual marker below the candle.
- Sell Signal: Triggered when the price closes decisively below the Lower Boundary, confirming a downward trend. The script then places a visual marker above the candle.
4. Smart Alerting and Notification To prevent "alert fatigue" (receiving too many notifications for the same move), the script includes a built-in cooling period. It tracks the time of the last alert; if a new signal occurs too quickly after the previous one, it will remain silent until the specified delay has passed. This ensures that traders are only notified of significant trend changes.
Summary for the User
Essentially, this tool filters out market "chatter" by measuring how much the price is moving compared to its recent average. It waits for a price break that is strong enough to overcome current volatility before notifying you, providing clear visual cues for when a new trend is being established.
//+------------------------------------------------------------------+
//| SilverTrend_Signal.mq4
//| Ramdass - Conversion only
//|   ..... v3e
//| Äîáàâëåíû ãëîáàëüûå ïåðåìåííûå.
//+------------------------------------------------------------------+
#property copyright "SilverTrend  rewritten by CrazyChart"
#property link      "http://viac.ru/"

#property indicator_chart_window
#property indicator_buffers 2
#property indicator_color1 DodgerBlue
#property indicator_color2 Magenta

//---- input parameters
extern int RISK=3;
extern int CountBars=350;
extern int Alert_Delay_In_Seconds=60;
int SSP=9;
int PrevAlertTime=0;
//---- buffers
double val1[];
double val2[];

//----------
//+------------------------------------------------------------------+
//| Custom indicator initialization function                         |
//+------------------------------------------------------------------+
int init()
  {
   string short_name;
//---- indicator line
   IndicatorBuffers(2);
   SetIndexStyle(0,DRAW_ARROW);
   SetIndexArrow(0,233);
   SetIndexStyle(1,DRAW_ARROW);
   SetIndexArrow(1,234);
   SetIndexBuffer(0,val1);
   SetIndexBuffer(1,val2);
//----
   return(0);
  }
//+------------------------------------------------------------------+
//| SilverTrend_Signal                                               |
//+------------------------------------------------------------------+
int start()
  {
   if (CountBars>=Bars) CountBars=Bars;
   SetIndexDrawBegin(0,Bars-CountBars+SSP);
   SetIndexDrawBegin(1,Bars-CountBars+SSP);
   int i,shift,counted_bars=IndicatorCounted();
   int i1,i2,K;
   double Range,AvgRange,smin,smax,SsMax,SsMin,price;
   bool uptrend,old;
//----

   if(Bars<=SSP+1) return(0);
//---- initial zero
   if(counted_bars<SSP+1)
   {
      for(i=1;i<=SSP;i++) val1[CountBars-i]=0.0;
      for(i=1;i<=SSP;i++) val2[CountBars-i]=0.0;
   }
   GlobalVariableSet("xSELL",0);
   GlobalVariableSet("xBUY",0);
//----

K=33-RISK;
for (shift = CountBars-SSP; shift>=0; shift--)
{

	Range=0;
	AvgRange=0;
	for (i1=shift; i1<=shift+SSP; i1++)
		{AvgRange=AvgRange+MathAbs(High[i1]-Low[i1]);
		}
	Range=AvgRange/(SSP+1);

SsMax=High[shift]; SsMin=Low[shift];
   for (i2=shift;i2<=shift+SSP-1;i2++)
        {
         price=High[i2];
         if(SsMax<price) SsMax=price;
         price=Low[i2];
         if(SsMin>=price)  SsMin=price;
        }

smin = SsMin+(SsMax-SsMin)*K/100;
smax = SsMax-(SsMax-SsMin)*K/100;
	val1[shift]=0;
	val2[shift]=0;
	if (Close[shift]<smin)
		{
		uptrend = false;
		}
	if (Close[shift]>smax)
		{
		uptrend = true;
		}
   if (uptrend!=old && uptrend==true)
   {
   val1[shift]=Low[shift]-Range*0.5;

   if (shift==0 &&   (CurTime() - PrevAlertTime > Period()*Alert_Delay_In_Seconds))
   {
   Alert("Silver Trend ",Period()," ",Symbol()," BUY");GlobalVariableSet("xBUY",1);
    PrevAlertTime = CurTime();
   }
   }
   if (uptrend!=old && uptrend==false)
   {

   val2[shift]=High[shift]+Range*0.5;
   if (shift==0 && (CurTime() - PrevAlertTime > Period()*Alert_Delay_In_Seconds))
   {
   Alert("Silver Trend ",Period()," ",Symbol()," SELL");GlobalVariableSet("xSELL",1);
    PrevAlertTime = CurTime();

   }
   }
   Comment(shift);
   old=uptrend;

}
   return(0);
  }
//+------------------------------------------------------------------+
Comments