SI-2
Download script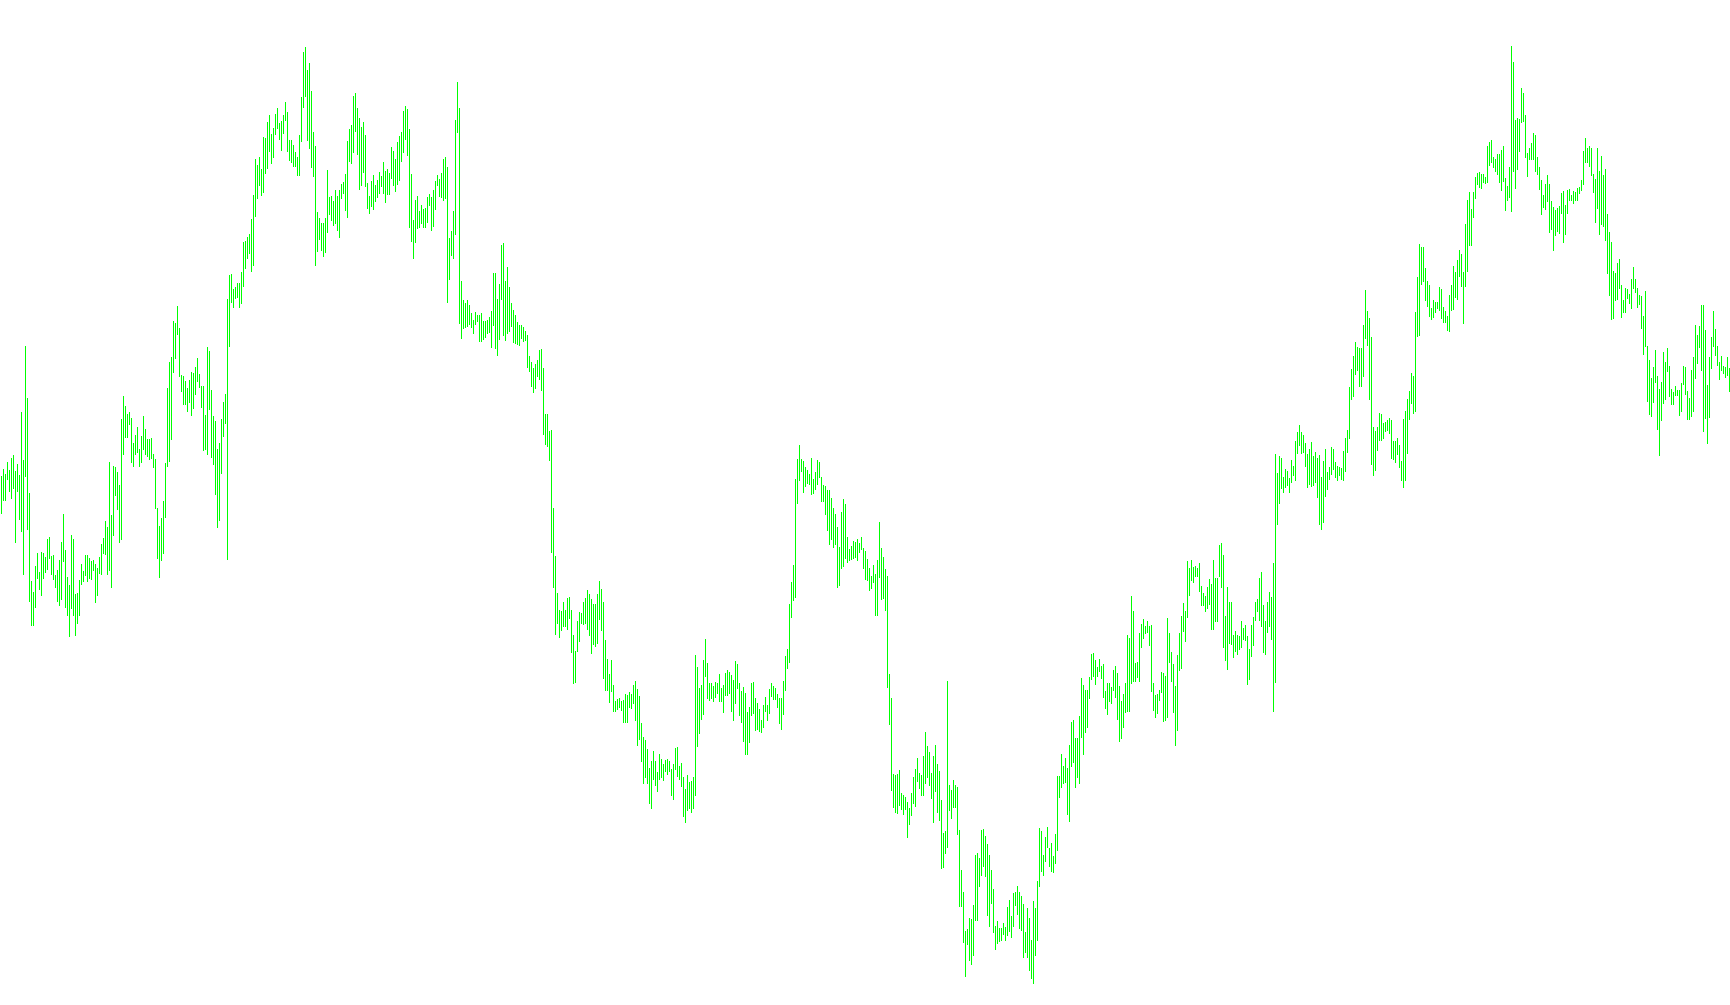
This script is designed as a custom technical analysis tool for the MetaTrader 4 platform. It functions as an oscillator, meaning it generates a visual line in a separate window below the main price chart to help traders identify momentum and potential trend shifts by analyzing the relationship between price movements over time.
Core Logic and Methodology
The script operates by examining the price action of each individual candle on the chart. Specifically, it looks at four key data points: the High, Low, Open, and Close prices of the current candle, as well as those of the preceding candle.
To determine the value displayed on the indicator, the logic follows these steps:
1. Range Measurement The script calculates several distinct price distances (ranges) between the current and previous candles. It focuses on how far the price has moved from the previous closing point to the current high and low, as well as the size of the "body" of the previous candle.
2. Determining the Dominant Movement The logic evaluates these ranges to identify the primary direction of the market's movement. It essentially asks: Is the price moving primarily toward the top, the bottom, or is it experiencing a wide-range expansion?
- If the movement is primarily upward, it applies a specific mathematical weight to that distance.
- If the movement is primarily downward, it applies a different set of weights.
- If the movement is sideways or shows high volatility relative to the body size, it prioritizes the total height of the price range.
3. Momentum Calculation Once the dominant movement is identified, the script calculates a "Momentum Value." It compares the current price change against the dominant range and adjusts this value based on the size of the previous candle's body. This helps to smooth out "noise" and focus on the strength of the actual trend rather than just raw price fluctuations.
4. Cumulative Smoothing Instead of showing a jagged, instantaneous jump for every price move, the script uses a cumulative approach. It takes the calculated momentum value and subtracts it from the previous value in the sequence. This creates a continuous, flowing line that represents the "velocity" of the market.
How to Interpret the Result
The final output is a moving line that reflects the cumulative momentum of the asset:
- Directional Trend: The upward or downward slope of the line indicates whether the current momentum is accelerating in one direction or the other.
- Strength: The steepness of the line's movement suggests how aggressively the price is trending.
- Stability: Because it accounts for the "body" of previous candles, the indicator seeks to provide a clearer picture of where the price is headed by filtering out minor, insignificant price fluctuations.
//+------------------------------------------------------------------+
//|                                                           SI.mq4 |
//|                                                             Raff |
//|                                                   raff1410@o2.pl |
//+------------------------------------------------------------------+
#property copyright "Raff"
#property link      "just_raff1410@yahoo.com"
//----
#property indicator_separate_window
#property indicator_buffers 1
#property indicator_color1 Red
//---- input parameters
extern double    T          =1;
extern int       CountBars  =10000;
//---- buffers
double ASI[];
//+------------------------------------------------------------------+
//| Custom indicator initialization function                         |
//+------------------------------------------------------------------+
int init()
  {
//---- indicators
   IndicatorBuffers(1);
   SetIndexStyle(0,DRAW_LINE);
   SetIndexBuffer(0,ASI);
//----
   return(0);
  }
//+------------------------------------------------------------------+
//| Custom indicator deinitialization function                       |
//+------------------------------------------------------------------+
int deinit()
  {
//----
//----
   return(0);
  }
//+------------------------------------------------------------------+
//| Custom indicator iteration function                              |
//+------------------------------------------------------------------+
int start()
  {
   int    i, counted_bars=IndicatorCounted();
//----
   double pHigh, pLow, pOpen, pClose;
   double pHigh_1, pLow_1, pOpen_1, pClose_1;
   double K, R, R_1, R_2, R_3, R_4, X, SI ;
//----
   if (CountBars>Bars) CountBars=Bars-10;
   i=CountBars-10;
   ASI[i+1]=0;
   while(i>=0)
     {
      pHigh   =High[i];
      pLow    =Low[i];
      pOpen   =Open[i];
      pClose  =Close[i];
      //
      pHigh_1 =High[i+1];
      pLow_1  =Low[i+1];
      pOpen_1 =Open[i+1];
      pClose_1=Close[i+1];
      //
      R_1     =MathAbs(pHigh-pClose_1);
      R_2     =MathAbs(pLow-pClose_1);
      R_3     =MathAbs(pHigh-pLow);
      R_4     =MathAbs(pClose_1-pOpen_1);
      K       =MathMax(R_1,R_2);
//----
      if (R_1>=MathMax(R_2,R_3))
        {
         R   =R_1 - R_2/2 + R_4/4;
        }
      else
         if (R_2>=MathMax(R_1,R_3))
           {
            R   =R_2 - R_1/2 + R_4/4;
           }
         else
           {
            R   =R_3 + R_4/4;
           }
      if (R==0) SI=0;
      else
        {
         X   =(pClose_1-pClose)+(pClose_1-pOpen_1)/2+(pClose-pOpen)/4;
         SI  =50 * (X/R) * (K/T);
        }
      ASI[i]=ASI[i+1]-SI;
      i--;
     }
//----
   return(0);
  }
//+------------------------------------------------------------------+
Comments