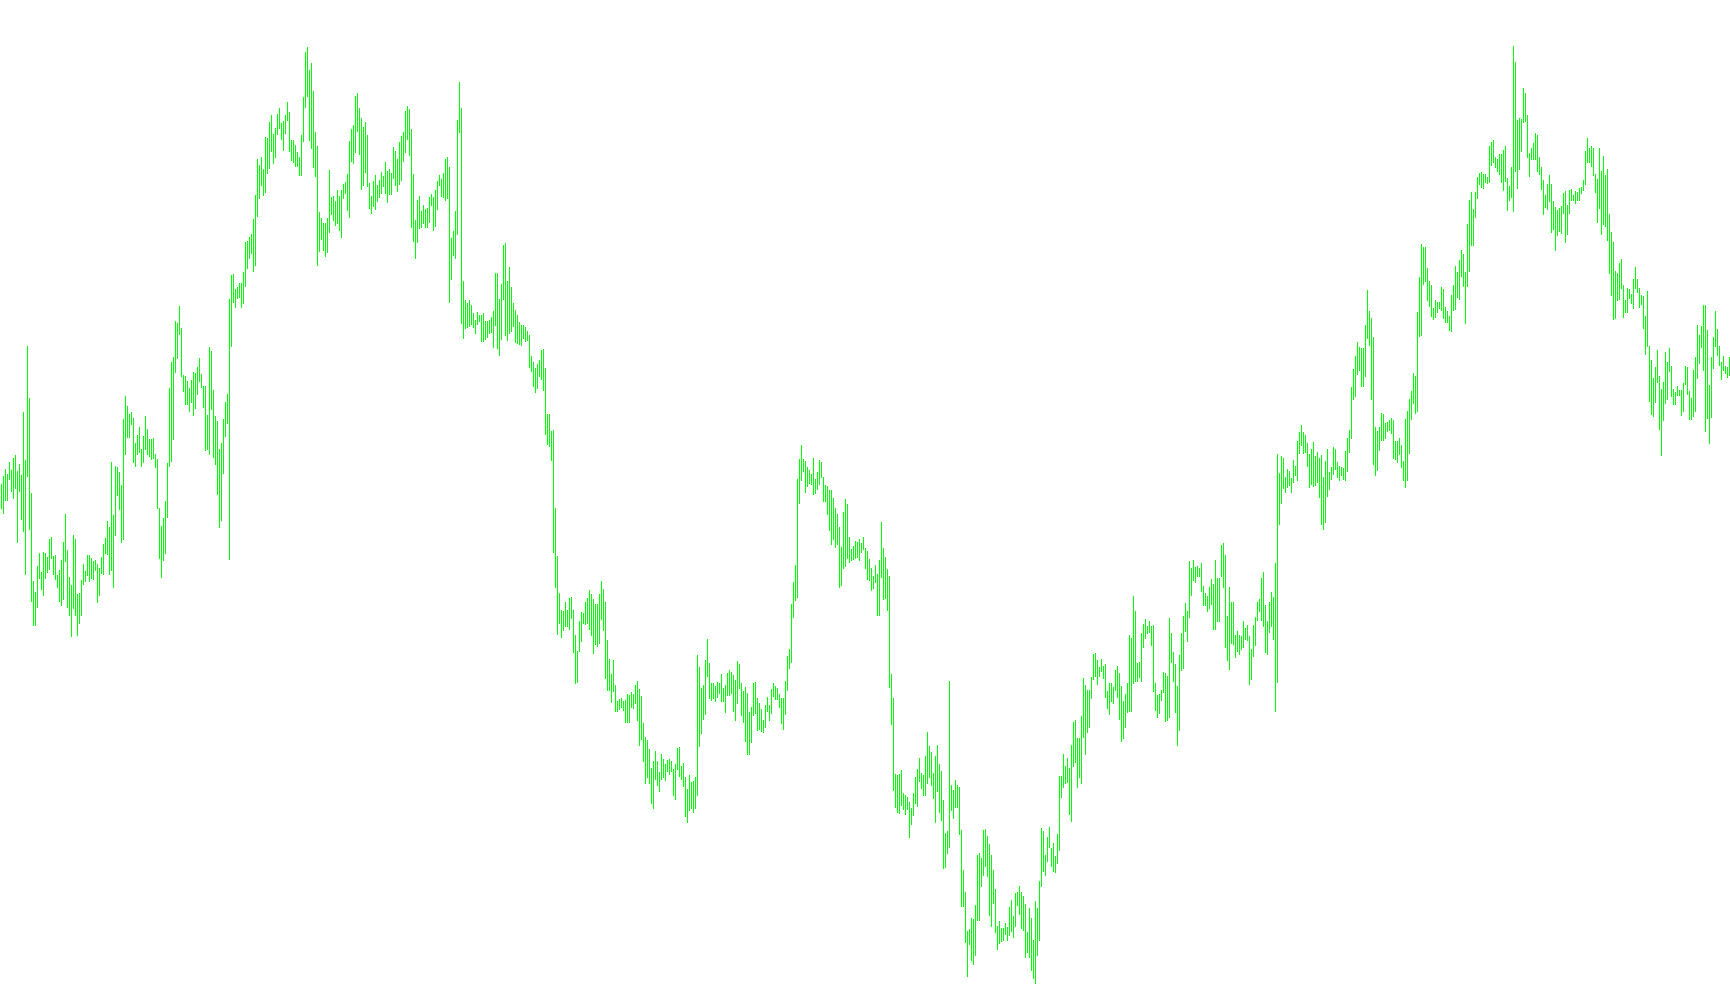
This tool is designed to provide a visual overlay on your trading charts, specifically focusing on highlighting the relationship between price action and historical data. Instead of simply showing standard candlesticks, it reconstructs visual elements to help traders identify specific price movements more clearly.
Core Functionality
The script works by analyzing a specific look-back period of market history. It scans the price data to identify the high, low, open, and close points of previous candles. Based on this information, it draws custom rectangular objects directly onto your chart. These objects act as "shadow" representations that mirror the past performance of the market.
Key Visual Components
The tool distinguishes between two main types of visual data:
- Shadow Elements: These represent the extended range or "wicks" of the price movement. They provide a sense of the total volatility and the limits reached during a specific timeframe.
- Body Elements: These highlight the actual range where the price spent the majority of its time. By separating these from the shadows, the tool allows you to see the difference between a "volatile move" (long shadow) and a "sustained move" (solid body).
Logic & Color Coding
The script automatically detects the sentiment of the price movement for each historical point and applies a distinct color scheme to make it easy to read at a glance:
- Bullish Movements: When the price opens higher than it closes, the tool uses a specific blue-toned palette (Light Sky Blue for bodies and Blue for shadows) to signify upward momentum.
- Bearish Movements: When the price opens lower than it closes, the tool switches to an orange-toned palette (Sandy Brown for bodies and Orange for shadows) to signify downward momentum.
User Experience
The tool is designed to be dynamic. It automatically clears old drawings when the script is updated or removed to keep your chart clean. By providing a distinct visual separation between the "body" of the price action and its "shadows," it allows traders to quickly assess historical volatility and price sentiment without cluttering the primary view of the current market.
//+------------------------------------------------------------------+
//|                                                ShadowCandles.mq4 |
//|                            Copyright © 2009, ÏàâåëÈâàíîâè÷ (api) |
//|                                              p231970@hotmail.com |
//+------------------------------------------------------------------+
#property copyright "Copyright © 2009, ÏàâåëÈâàíîâè÷ (api)"
#property link      "p231970@hotmail.com"

#property indicator_chart_window
//---- input parameters
extern int       iPeriod=60;
extern int       iNumCandles=100;
extern color     BullCandle=LightSkyBlue;
extern color     BearCandle=SandyBrown;
extern color     BullShadow=Blue;
extern color     BearShadow=Orange;

double data[][6];

//+------------------------------------------------------------------+
//| Custom indicator deinitialization function                       |
//+------------------------------------------------------------------+
int deinit()
{
   for(int i=0;i<iNumCandles;i++)
   {
      ObjectDelete("ShadowCandle"+i);
      ObjectDelete("ShadowCandleShadow"+i);
   }
   return(0);
}
//+------------------------------------------------------------------+
//| Custom indicator iteration function                              |
//+------------------------------------------------------------------+
int start()
{
   if(iPeriod<=Period()) return(0);

   ArrayCopyRates(data,NULL,iPeriod);
   for(int i=0;i<iNumCandles;i++)
   {
      if(i>0) data[i][5] = data[i-1][0]-60*Period();
      else data[0][5]= Time[0];
      DrawCandle(i);
   }
}

void DrawCandle(int bar)
{
   string name1 = "ShadowCandleShadow"+bar;
   string name2 = "ShadowCandle"+bar;
   if(!ObjectCreate(name1,OBJ_RECTANGLE,0,data[bar][0],data[bar][2],data[bar][5],data[bar][3]))
   {
      ObjectSet(name1,OBJPROP_TIME1,data[bar][0]);
      ObjectSet(name1,OBJPROP_TIME2,data[bar][5]);
      ObjectSet(name1,OBJPROP_PRICE1,data[bar][2]);
      ObjectSet(name1,OBJPROP_PRICE2,data[bar][3]);
   }
   ObjectSet(name1,OBJPROP_BACK,false);
   if(!ObjectCreate(name2,OBJ_RECTANGLE,0,data[bar][0],data[bar][1],data[bar][5],data[bar][4]))
   {
      ObjectSet(name2,OBJPROP_TIME1,data[bar][0]);
      ObjectSet(name2,OBJPROP_TIME2,data[bar][5]);
      ObjectSet(name2,OBJPROP_PRICE1,data[bar][1]);
      ObjectSet(name2,OBJPROP_PRICE2,data[bar][4]);
   }
   ObjectSet(name2,OBJPROP_BACK,true);
   if(data[bar][1]<data[bar][4])
   {
      ObjectSet(name1,OBJPROP_COLOR, BullShadow);
      ObjectSet(name2,OBJPROP_COLOR, BullCandle);
   }else
   {
      ObjectSet(name1,OBJPROP_COLOR, BearShadow);
      ObjectSet(name2,OBJPROP_COLOR, BearCandle);
   }
}
//+------------------------------------------------------------------+
Comments