SecondChart
Download script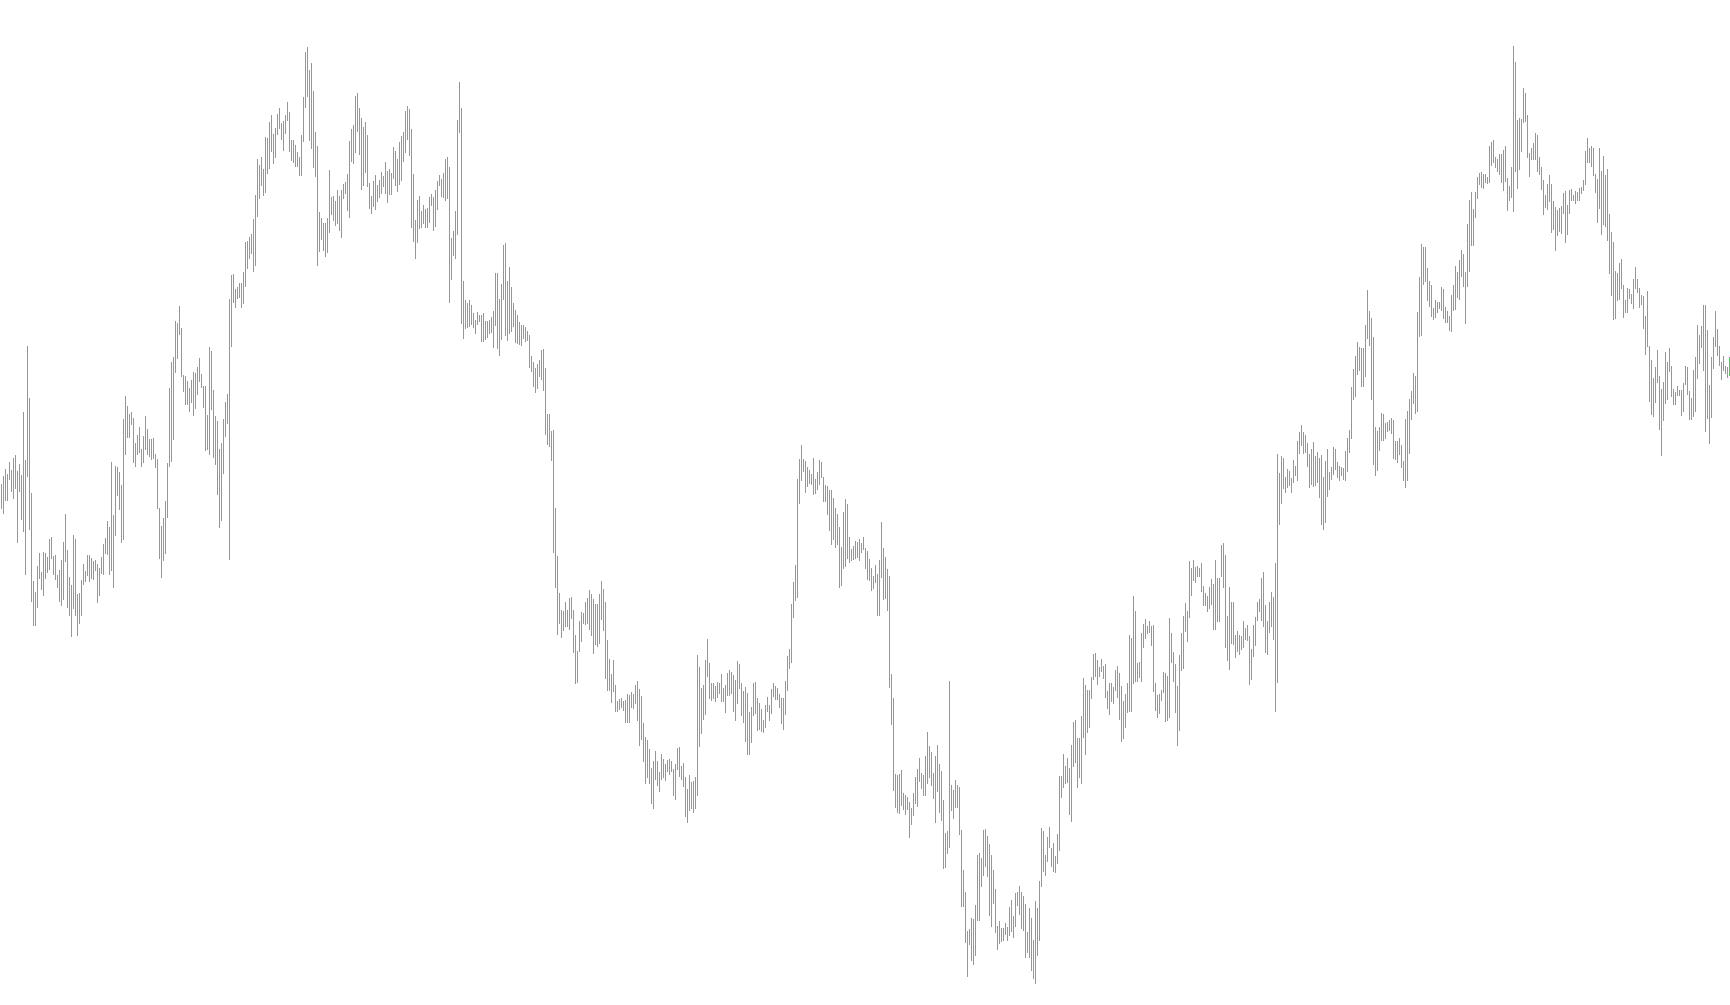
This script is designed as a visual utility for the MetaTrader 4 platform, allowing traders to monitor a second currency pair simultaneously on their current screen. Instead of forcing you to switch between different windows to check another market, this tool renders a simplified graphical representation of that second market directly into your primary workspace.
Core Functionality
Multi-Market Visualization The primary purpose of the script is to fetch and display price data for a specific currency pair (which you can define in the settings). It captures the "candles" or price bars of that secondary pair and draws them as a histogram at the bottom of your chart. This allows for quick, at-a-glance comparisons between the market you are currently trading and another market of interest.
Dynamic Price Tracking The script provides real-time updates for the current price (the "Bid") of the chosen secondary pair. It can be configured to perform two specific visual tasks:
- Horizontal Reference Line: It can draw a steady horizontal line that moves automatically with the current market price.
- Price Labeling: It can display a floating text label showing the exact numerical value of that price, making it easy to track fluctuations without squinting at the axes.
How the Logic Works
Data Retrieval and Processing The script scans historical data for the secondary currency pair based on a specific timeframe you select (e.g., 1-minute, 1-hour, Daily, etc.). It looks at the "Open," "High," "Low," and "Close" prices for each bar in that timeframe.
Visual Representation To make the data easy to read, the script uses a color-coded system to distinguish between different types of market movement:
- Bullish Movement: If the price closed higher than it opened, the script renders a green body and shadow.
- Bearish Movement: If the price closed lower than it opened, it renders a red body and shadow.
- Neutral Movement: If there was no change in the closing price, it is represented in white.
The "Body" of the histogram represents the main movement (the difference between open and close), while the "Shadows" indicate the high and low extremes reached during that timeframe.
Efficiency Measures To ensure your platform remains responsive and doesn't slow down your computer, the script includes smart processing logic. It limits the amount of historical data it calculates at once (based on a user-defined bar count) and only refreshes the necessary information as new price ticks arrive. If it encounters an error while trying to fetch data, it has a built-in retry mechanism to attempt to reconnect smoothly.
//+------------------------------------------------------------------+
//|                                                  SecondChart.mq4 |
//|                                   Copyright © 2008, Serega Lykov |
//|                                       http://mtexperts.narod.ru/ |
//+------------------------------------------------------------------+

#property copyright "Copyright © 2008, Serega Lykov"
#property link      "http://mtexperts.narod.ru/"

//---- property of indicator ----------------------------------------+
#property indicator_separate_window
#property indicator_buffers 8
#property indicator_color1 Green              // color of body, if Close > Open
#property indicator_color2 Red                // color of body, if Close < Open
#property indicator_color3 White              // color of body, if Close = Open
#property indicator_color4 Black              // color of background
#property indicator_color5 Green              // color of shadow, if Close > Open
#property indicator_color6 Red                // color of shadow, if Close < Open
#property indicator_color7 White              // color of shadow, if Close = Open
#property indicator_color8 Black              // color of background
#property indicator_width1 4                  // width of body, if Close > Open
#property indicator_width2 4                  // width of body, if Close < Open
#property indicator_width3 4                  // width of body, if Close = Open
#property indicator_width4 4                  // width of background
#property indicator_width5 1                  // width of shadow, if Close > Open
#property indicator_width6 1                  // width of shadow, if Close < Open
#property indicator_width7 1                  // width of shadow, if Close = Open
#property indicator_width8 1                  // width of background

//---- external parameters ------------------------------------------+
extern string CurrencyPair        = "EURUSD"; // the currency pair for second chart
extern int    TimeFrame           = 0;        // the period for second chart: 0 = current chart,
                                              // 1 = M1, 5 = M5, 15 = M15, 30 = M30, 60 = H1,
                                              // 240 = H4, 1440 = D1, 10080 = W1, 43200 = MN1
extern bool   ShowBidLine         = true;     // true = draw horizontal line at Bid
extern bool   ShowBidLabel        = true;     // true = show label with a value of Bid
extern color  ColorBid            = LightSlateGray; // the color of line at Bid and label with a value of Bid
extern int    OffsetLabel         = 5;        // offset (from current bar) for label
extern int    CountBars           = 500;      // how many bars to calculate; 0 = all bars

//---- buffers ------------------------------------------------------+
static double UpBodyBuffer[];
static double DnBodyBuffer[];
static double EqBodyBuffer[];
static double BgBodyBuffer[];
static double UpShadowBuffer[];
static double DnShadowBuffer[];
static double EqShadowBuffer[];
static double BgShadowBuffer[];

//---- global variables ---------------------------------------------+
static bool   recalculate;
static int    digits;
static int    offset_label;
static int    attempts;
static double point;
static string symbol;
static string short_name;
static string hline_bid = "hline_bid";
static string label_bid = "label_bid";

//---- initialization of indicator ----------------------------------+
int init()
  {
   //---- set a constants -------------------------------------------+
   int len_symbol  = StringLen(Symbol());
   int len_curpair = StringLen(CurrencyPair);
   if(len_curpair >= len_symbol) symbol = StringSubstr(CurrencyPair,0,len_symbol);
   else symbol = StringConcatenate(CurrencyPair,StringSubstr(Symbol(),len_curpair,len_symbol));
   point = MarketInfo(symbol,MODE_POINT);
   digits = MarketInfo(symbol,MODE_DIGITS);
   offset_label = Period() * 60 * OffsetLabel;
   recalculate = true;
   attempts = 10;
   //---- set a "short" name of the indicator -----------------------+
   short_name = StringConcatenate(CurrencyPair," ",GetStrPeriod(TimeFrame));
   IndicatorShortName(short_name);
   //---- set a accuracy of values of the indicator -----------------+
   IndicatorDigits(digits);
   //---- set a style for line --------------------------------------+
   SetIndexStyle(0,DRAW_HISTOGRAM,STYLE_SOLID,4);
   SetIndexStyle(1,DRAW_HISTOGRAM,STYLE_SOLID,4);
   SetIndexStyle(2,DRAW_HISTOGRAM,STYLE_SOLID,4);
   SetIndexStyle(3,DRAW_HISTOGRAM,STYLE_SOLID,4);
   SetIndexStyle(4,DRAW_HISTOGRAM,STYLE_SOLID,1);
   SetIndexStyle(5,DRAW_HISTOGRAM,STYLE_SOLID,1);
   SetIndexStyle(6,DRAW_HISTOGRAM,STYLE_SOLID,1);
   SetIndexStyle(7,DRAW_HISTOGRAM,STYLE_SOLID,1);
   //---- set a arrays for line -------------------------------------+
   SetIndexBuffer(0,UpBodyBuffer);
   SetIndexBuffer(1,DnBodyBuffer);
   SetIndexBuffer(2,EqBodyBuffer);
   SetIndexBuffer(3,BgBodyBuffer);
   SetIndexBuffer(4,UpShadowBuffer);
   SetIndexBuffer(5,DnShadowBuffer);
   SetIndexBuffer(6,EqShadowBuffer);
   SetIndexBuffer(7,BgShadowBuffer);
   //---- finish of initialization ----------------------------------+
   return(0);
  }

//---- deinitialization of indicator --------------------------------+
int deinit()
  {
   if(ShowBidLine)  ObjectDelete(hline_bid);
   if(ShowBidLabel) ObjectDelete(label_bid);
   return(0);
  }

//---- SecondChart --------------------------------------------------+
int start()
  {
   //---- amount not changed bars after last call of the indicator --+
   int counted_bars = IndicatorCounted();
   if(counted_bars < 0) return(-1);
   if(recalculate)
     {
      int limit = Bars;
      recalculate = false;
     }
   else limit = Bars - counted_bars;
   if(CountBars > 0) if(limit > CountBars) limit = CountBars;
   //---- set values of candles -------------------------------------+
   for(int i=limit; i>=0; i--)
     {
      double open  = NormalizeDouble(iOpen(symbol,TimeFrame,i),digits);
      double close = NormalizeDouble(iClose(symbol,TimeFrame,i),digits);
      double high  = NormalizeDouble(iHigh(symbol,TimeFrame,i),digits);
      double low   = NormalizeDouble(iLow(symbol,TimeFrame,i),digits);
      if(open == 0 || close == 0 || high == 0 || low == 0)
        {
         if(attempts > 0)
           {
            attempts--;
            recalculate = true;
            return(0);
           }
        }
      if(open < close)
        {
         UpBodyBuffer[i] = close;
         DnBodyBuffer[i] = EMPTY_VALUE;
         EqBodyBuffer[i] = EMPTY_VALUE;
         BgBodyBuffer[i] = open;
         UpShadowBuffer[i] = high;
         DnShadowBuffer[i] = EMPTY_VALUE;
         EqShadowBuffer[i] = EMPTY_VALUE;
         BgShadowBuffer[i] = low;
        }
      else
        {
         if(open > close)
           {
            UpBodyBuffer[i] = EMPTY_VALUE;
            DnBodyBuffer[i] = open;
            EqBodyBuffer[i] = EMPTY_VALUE;
            BgBodyBuffer[i] = close;
            UpShadowBuffer[i] = EMPTY_VALUE;
            DnShadowBuffer[i] = high;
            EqShadowBuffer[i] = EMPTY_VALUE;
            BgShadowBuffer[i] = low;
           }
         else
           {
            UpBodyBuffer[i] = EMPTY_VALUE;
            DnBodyBuffer[i] = EMPTY_VALUE;
            EqBodyBuffer[i] = open;
            BgBodyBuffer[i] = open - point;
            UpShadowBuffer[i] = EMPTY_VALUE;
            DnShadowBuffer[i] = EMPTY_VALUE;
            if(high == low)
              {
               EqShadowBuffer[i] = EMPTY_VALUE;
               BgShadowBuffer[i] = EMPTY_VALUE;
              }
            else
              {
               EqShadowBuffer[i] = high;
               BgShadowBuffer[i] = low;
              }
           }
        }
     }
   //---- draw Bid line ---------------------------------------------+
   if(ShowBidLine)
     {
      if(ObjectFind(hline_bid) < 0)
        {
         ObjectCreate(hline_bid,OBJ_HLINE,WindowFind(short_name),0,close);
         ObjectSet(hline_bid,OBJPROP_STYLE,STYLE_SOLID);
         ObjectSet(hline_bid,OBJPROP_COLOR,ColorBid);
        }
      double obj_level = NormalizeDouble(ObjectGet(hline_bid,OBJPROP_PRICE1),digits);
      if(obj_level != close) ObjectMove(hline_bid,0,Time[0],close);
     }
   //---- show Bid value --------------------------------------------+
   if(ShowBidLabel)
     {
      datetime dt_offset = Time[0] + offset_label;
      if(ObjectFind(label_bid) < 0)
        {
         ObjectCreate(label_bid,OBJ_TEXT,WindowFind(short_name),dt_offset,close);
         ObjectSetText(label_bid,DoubleToStr(close,digits),8,"Arial",ColorBid);
        }
      obj_level = NormalizeDouble(ObjectGet(label_bid,OBJPROP_PRICE1),digits);
      if(ObjectGet(label_bid,OBJPROP_TIME1) != dt_offset || obj_level != close)
        {
         ObjectMove(label_bid,0,dt_offset,close);
         ObjectSetText(label_bid,DoubleToStr(close,digits),8,"Arial",ColorBid);
        }
     }
   //---- finish of iteration ---------------------------------------+
   return(0);
  }

//---- GetStrPeriod -------------------------------------------------+
string GetStrPeriod(int timeframe)
  {
   switch(timeframe)
     {
      case 1: string period = "M1";  break;
      case 5:        period = "M5";  break;
      case 15:       period = "M15"; break;
      case 30:       period = "M30"; break;
      case 60:       period = "H1";  break;
      case 240:      period = "H4";  break;
      case 1440:     period = "D1";  break;
      case 10080:    period = "W1";  break;
      case 43200:    period = "MN1"; break;
      default: period = GetStrPeriod(Period()); TimeFrame = 0;
     }
   return(period);
  }

//+------------------------------------------------------------------+
Comments