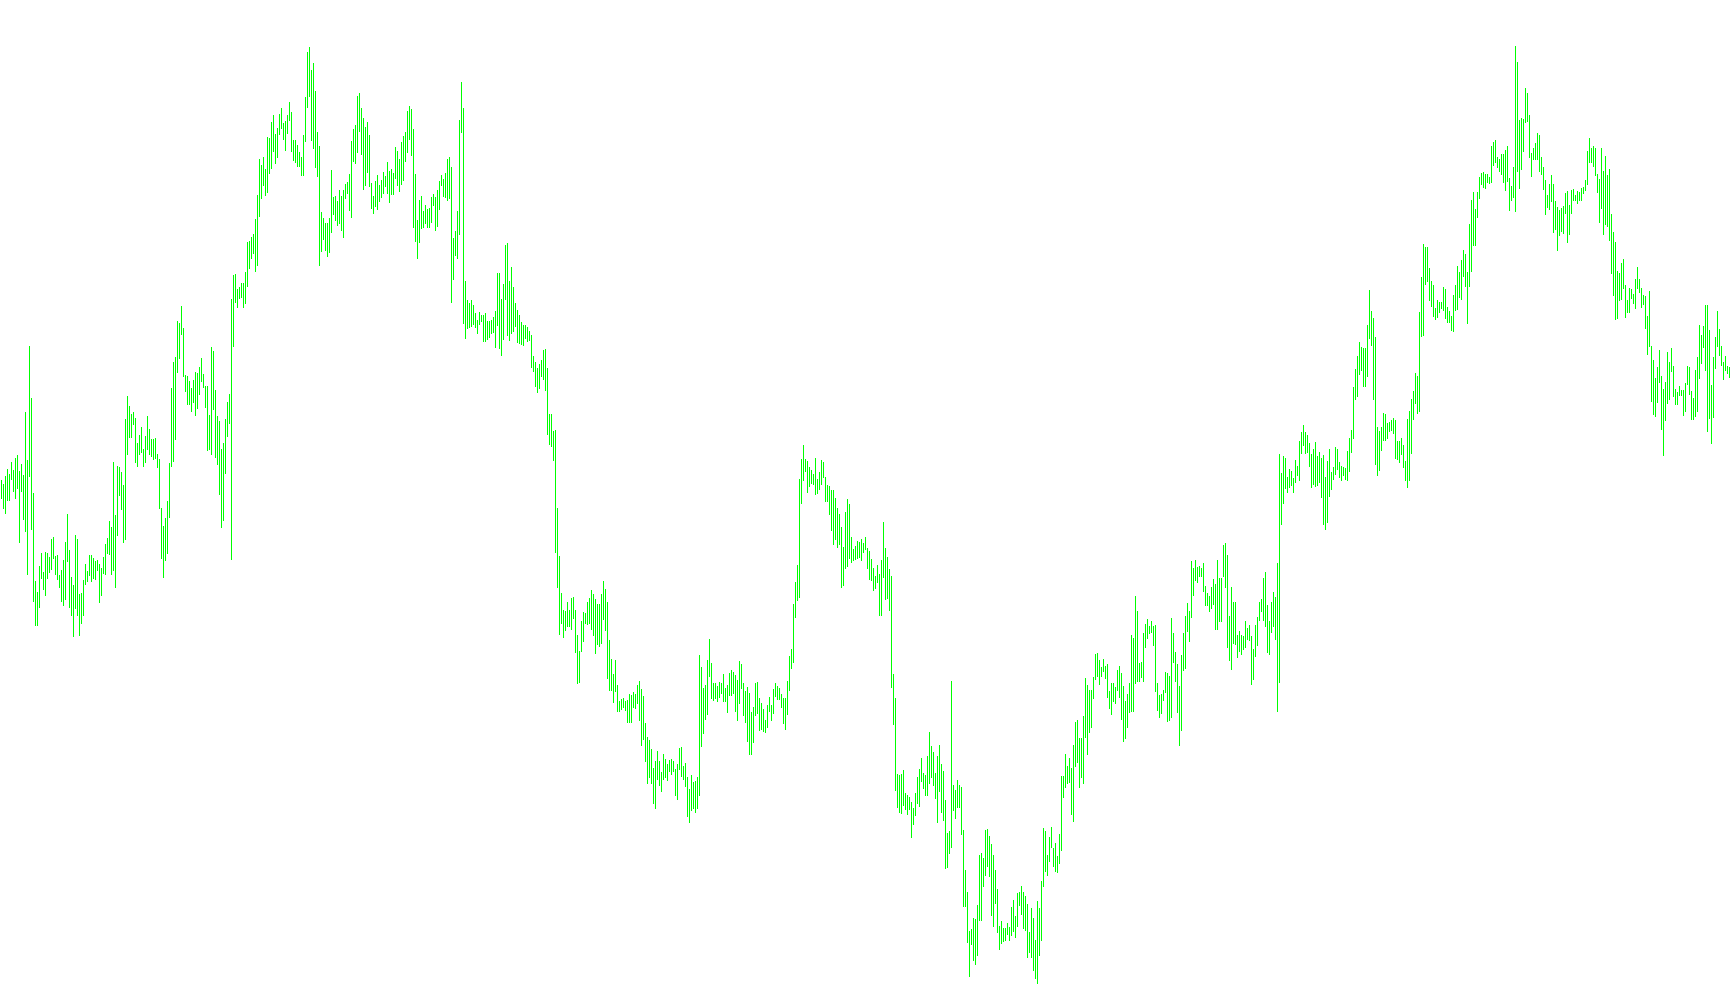
This script is designed to help traders better visualize the passage of time across different global markets by automatically plotting chronological markers on their trading charts. Instead of having to manually calculate when specific sessions begin or end, this tool identifies key hours and places visual cues directly on the price history.
Core Functionality
The tool scans your historical price data to identify four specific time-based milestones. When it detects a bar that matches one of these predefined times, it draws a vertical dashed line at that exact point on your screen.
The markers are categorized as follows:
- EST (Eastern Standard Time): Highlighted with a Blue dashed line.
- MST (Mountain Standard Time): Highlighted with a Red dashed line.
- GMT (Greenwich Mean Time): Highlighted with a Yellow dashed line.
- Broker Time: Highlighted with a White dashed line, marking the midnight reset for your specific trading platform.
Key Features and Behavior
- Automated Visual Mapping: The script automatically looks back through a significant amount of historical data (up to 500 bars by default) to ensure that past price action is clearly marked with these time boundaries.
- Dynamic Cleanup: To keep your charts organized, the script includes a "cleanup" mechanism. When you remove the indicator from your chart, it automatically deletes all the lines it created, leaving your workspace clean.
- Customizable Timeframes: The logic allows for specific hour settings (e.g., 7, 6, and 2) to be defined, ensuring that the visual markers align with the specific regional hours you are monitoring.
- Precision Timing: The tool is programmed to trigger the line creation specifically at the "00" minute mark of each designated hour, providing a clean, organized grid rather than cluttering the chart.
This tool is primarily intended for traders who need to coordinate trades across multiple time zones simultaneously or those who want to clearly see how market behavior shifts during specific global openings and closings.
//+------------------------------------------------------------------+
//|                                                    TimeZones.mq4 |
//|                       Copyright © 2004, MetaQuotes Software Corp. |
//|                                         http://www.metaquotes.net |
//|                                Made/Modified by Alejandro Galindo |
//|                                                                   |
//|                                                                   |
//|                       if this work/modification is helpful to you |
//|                      send me a PayPal donation to ag@elcactus.com |
//|                                         any help is apreciated :) |
//|                                                           Thanks. |
//+-------------------------------------------------------------------+
#property copyright "Copyright © 2005. Alejandro Galindo"
#property link      "http://elCactus.com"

#property indicator_chart_window

extern int EST=7;
extern int MST=6;
extern int GMT=2;
extern int CountBars=500;
//+------------------------------------------------------------------+
//| Custom indicator initialization function                         |
//+------------------------------------------------------------------+
int init()
  {
//---- indicators
//----
   return(0);
  }
//+------------------------------------------------------------------+
//| Custor indicator deinitialization function                       |
//+------------------------------------------------------------------+
int deinit()
  {
//----
   int shift=0;
   for  (shift=Bars-1;shift>=0;shift--) {
   ObjectDelete("EST"+shift);
   ObjectDelete("MST"+shift);
   ObjectDelete("GMT"+shift);
   ObjectDelete("Broker"+shift);
   }
//----
   return(0);
  }
//+------------------------------------------------------------------+
//| Custom indicator iteration function                              |
//+------------------------------------------------------------------+
int start()
  {
   int    counted_bars=IndicatorCounted();
   int shift, NumBars=500;
   double CloseTime,OpenTime;

   if (Bars<CountBars)  { NumBars=Bars-1; } else { NumBars=CountBars; }

   for  (shift=Bars-1;shift>=0;shift--) {

//      OpenTime=StrToTime(TimeDay(Time[shift])+" "+EST+":"+OpenTimeMin);
//      CloseTime=StrToTime(TimeDay(Time[shift])+" "+MST+":"+CloseTimeMin);


	  if (TimeHour(Time[shift])== EST && TimeMinute(Time[shift])==0) {
	     if(ObjectFind("EST"+shift) != 0)
         {
            ObjectCreate("EST"+shift, OBJ_VLINE, 0, Time[shift], 0);
            ObjectSet("EST"+shift, OBJPROP_STYLE, STYLE_DASHDOTDOT);
            ObjectSet("EST"+shift, OBJPROP_COLOR, Blue);
         }
      }

     	  if (TimeHour(Time[shift])== MST && TimeMinute(Time[shift])==0) {
	     if(ObjectFind("MST"+shift) != 0)
         {
            ObjectCreate("MST"+shift, OBJ_VLINE, 0, Time[shift], 0);
            ObjectSet("MST"+shift, OBJPROP_STYLE, STYLE_DASHDOTDOT);
            ObjectSet("MST"+shift, OBJPROP_COLOR, Red);
         }
      }

      if (TimeHour(Time[shift])== GMT && TimeMinute(Time[shift])==0) {
	     if(ObjectFind("GMT"+shift) != 0)
         {
            ObjectCreate("GMT"+shift, OBJ_VLINE, 0, Time[shift], 0);
            ObjectSet("GMT"+shift, OBJPROP_STYLE, STYLE_DASHDOTDOT);
            ObjectSet("GMT"+shift, OBJPROP_COLOR, Yellow);
         }
      }

      if (TimeHour(Time[shift])== 0 && TimeMinute(Time[shift])==0) {
	     if(ObjectFind("Broker"+shift) != 0)
         {
            ObjectCreate("Broker"+shift, OBJ_VLINE, 0, Time[shift], 0);
            ObjectSet("Broker"+shift, OBJPROP_STYLE, STYLE_DASHDOTDOT);
            ObjectSet("Broker"+shift, OBJPROP_COLOR, White);
         }
      }

   }


   return(0);
  }
//+------------------------------------------------------------------+
Comments