+RSI-TC_v2
Download script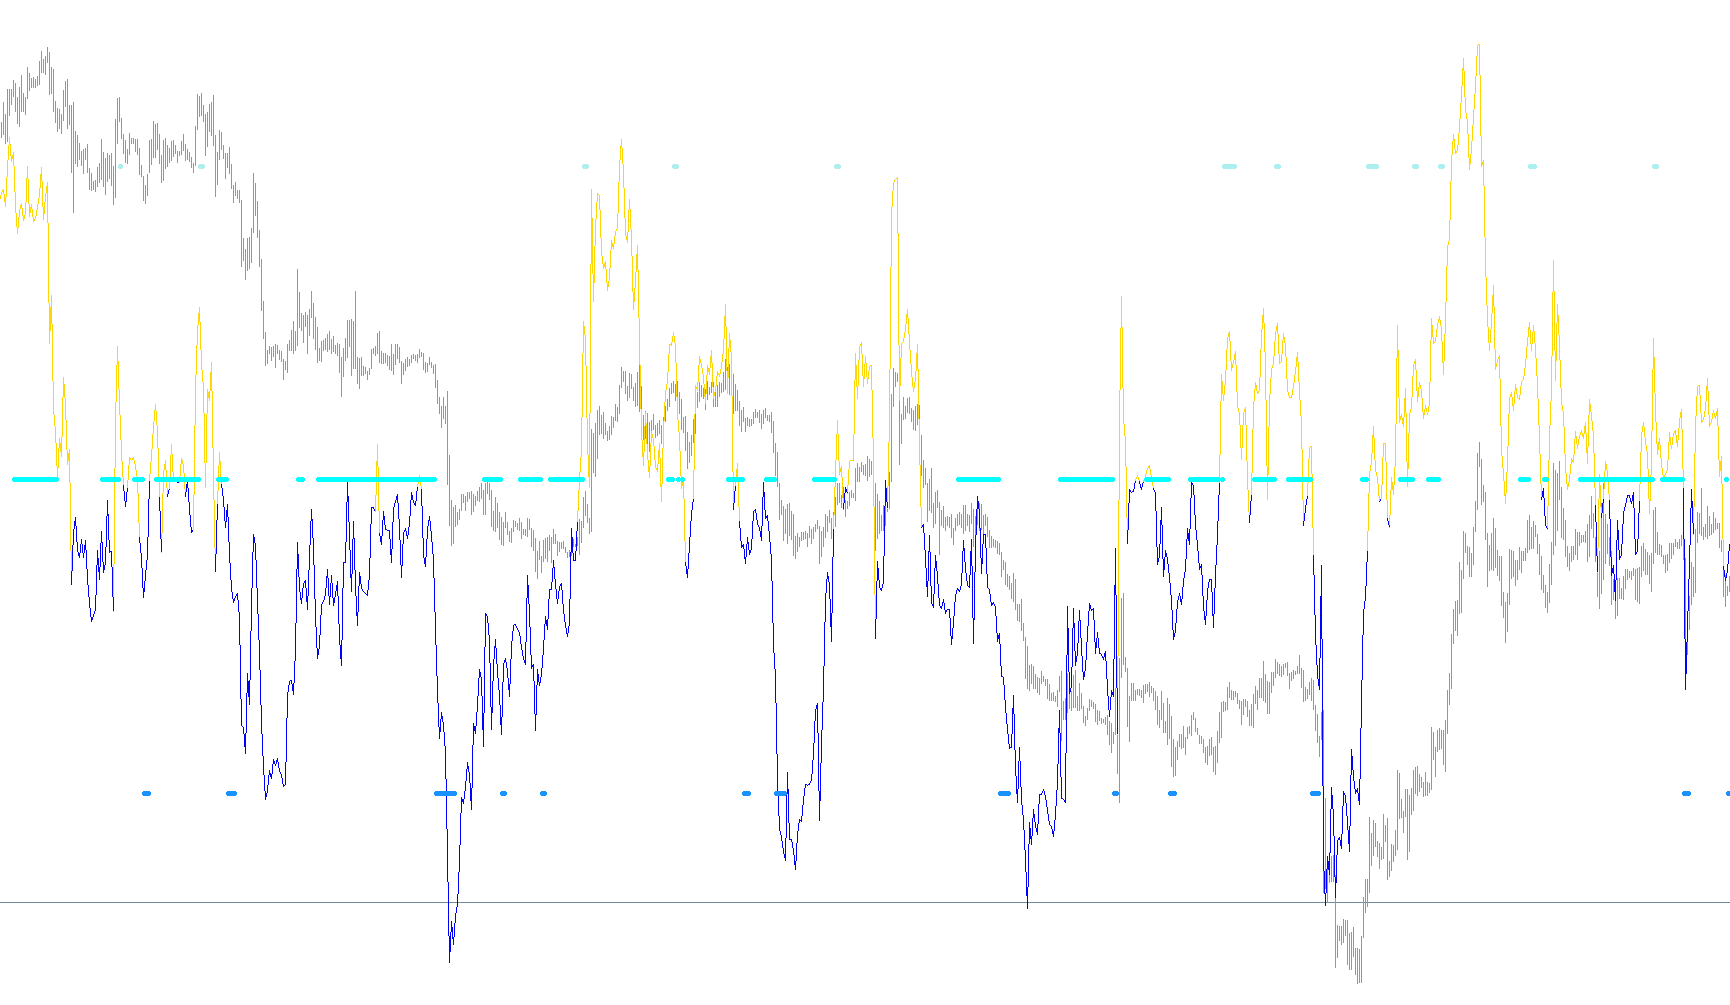
Overview
The RSI-TC is a specialized technical analysis tool designed for the MetaTrader platform. It combines three distinct market theories—Relative Strength Index (RSI), Bollinger Bands, and Keltner Channels—into a single visual interface. The primary goal of this script is to identify high-probability momentum shifts by detecting when market volatility "squeezes" and subsequently breaks out in a specific direction.
Core Logic Components
1. Two-Tone RSI Filtering
The script utilizes the Relative Strength Index (RSI) to measure price velocity. Unlike a standard RSI, this tool employs a "Two-tone" logic. It monitors the momentum to differentiate between bullish and bearish trends:
- It tracks whether the market is currently in a state of downward pressure or upward movement based on predefined levels.
- By filtering the RSI data this way, the tool helps visually separate distinct trends, making it easier for traders to see which direction the current momentum is favoring.
2. The "Squeeze" Detection
A significant portion of the logic is dedicated to identifying market consolidation (the "Squeeze"). To do this, the script compares two different types of volatility envelopes:
- Bollinger Bands: These contract based on standard deviation.
- Keltner Channels: These expand based on Average True Range (ATR).
When the Bollinger Bands move inside the Keltner Channels, the script identifies a "Squeeze." In market terms, this indicates that price volatility is extremely low and the market is "coiled" like a spring, preparing for an imminent explosive move.
3. Breakout Signal Generation
The most critical function of the script is determining the direction of the breakout once a Squeeze occurs. The logic looks for specific conditions to trigger visual signals (Arrows) and alerts:
- Buy Signals: Triggered when a Squeeze is detected, the RSI shows strength (above 50), and the lower Bollinger Band begins to expand/contract in a way that suggests upward momentum.
- Sell Signals: Triggered when a Squeeze is detected, the RSI shows weakness (below 50), and the upper Bollinger Band indicates a downward move.
- Trend Continuation: The script also monitors previous bars to confirm if an existing breakout trend is continuing or if it has lost momentum.
User Experience and Alerts
To ensure traders do not have to watch the charts constantly, the script includes a notification system. When the logic confirms a valid Buy or Sell signal based on the combination of the Squeeze, RSI momentum, and Band expansion, the tool will trigger a pop-up alert.
This provides a comprehensive "all-in-one" view: it identifies the period of quiet preparation (the Squeeze), confirms the strength of the move (RSI), and highlights the exact moment of the breakout (the Signal).
//+------------------------------------------------------------------+
//|                 +RSI-TC                                          |
//|                 RSI with Trend Catcher signal                    |
//|                 by Matsu                                         |
//|                 based on codes from various sources              |
//+------------------------------------------------------------------+
#property indicator_separate_window
#property indicator_buffers 5
//----
#property indicator_color1 Lime
#property indicator_color2 Red
#property indicator_color3 Black
#property indicator_color4 Black
#property indicator_color5 Black
//----
#property indicator_level1 70
#property indicator_level2 50
#property indicator_level3 30
//----
int       BBPrd=20;
double    BBDev=2.0;
int       SBPrd=13;
int       SBATRPrd=21;
double    SBFactor=2;
int       SBShift=1;
//----
extern int       RSIPeriod=21;
extern int       BullLevel=50;
extern int       BearLevel=50;
extern bool      AlertOn=true;
//----
double RSI[];
double DnRSI[];
double Buy[];
double Sell[];
double Squeeze[];
//+------------------------------------------------------------------+
//|                                                                  |
//+------------------------------------------------------------------+
int init()
  {
   IndicatorBuffers(5);
//----
   SetIndexStyle(0,DRAW_LINE);
   SetIndexBuffer(0,RSI);
   SetIndexStyle(1,DRAW_LINE);
   SetIndexBuffer(1,DnRSI);
   SetIndexStyle(2,DRAW_ARROW,STYLE_SOLID);
   SetIndexArrow(2,159);
   SetIndexBuffer(2,Buy);
   SetIndexStyle(3,DRAW_ARROW,STYLE_SOLID);
   SetIndexArrow(3,159);
   SetIndexBuffer(3,Sell);
   SetIndexStyle(4,DRAW_ARROW,STYLE_SOLID);
   SetIndexArrow(4,159);
   SetIndexBuffer(4,Squeeze);
//----
   IndicatorShortName("RSI("+RSIPeriod+")");
   IndicatorDigits(2);
//----
   return(0);
  }
//+------------------------------------------------------------------+
//|                                                                  |
//+------------------------------------------------------------------+
int start()
  {
   int counted_bars=IndicatorCounted();
   int shift,limit,ob,os;
   double BBMA, SBMA, TopBBand, BotBBand, TopBBandPrev, BotBBandPrev, TopSBand, BotSBand;
   bool dn=false;
   double BuyNow, BuyPrevious, SellNow, SellPrevious;
   static datetime prevtime=0;
//----
   if (counted_bars<0) return(-1);
   if (counted_bars>0) counted_bars--;
   limit=Bars-31;
   if(counted_bars>=31) limit=Bars-counted_bars-1;
//----
   for(shift=limit;shift>=0;shift--)
     {
      RSI[shift]=iRSI(NULL,0,RSIPeriod,PRICE_CLOSE,shift);
      ob=indicator_level1;
      os=indicator_level3;
      // ========= Two-tone RSI
      if (dn==true)
        {
         if (RSI[shift]>BullLevel)
           {
            dn=false;
            DnRSI[shift]=EMPTY_VALUE;
           }
         else
           {
            dn=true;
            DnRSI[shift]=RSI[shift];
           }
        }
      else
        {
         if (RSI[shift]<BearLevel)
           {
            dn=true;
            DnRSI[shift]=RSI[shift];
           }
         else
           {
            dn=false;
            DnRSI[shift]=EMPTY_VALUE;
           }
        }
      // ========= Two-tone RSI Ends
      // ========= Squeeze Signals
      BBMA    =iMA(NULL,0,BBPrd,0,MODE_SMA,PRICE_CLOSE,shift);
      SBMA    =iMA(NULL,0,SBPrd,0,MODE_EMA,PRICE_CLOSE,shift+SBShift);
      TopBBand=iBands(NULL,0,BBPrd,BBDev,0,PRICE_CLOSE,MODE_UPPER,shift);
      BotBBand=iBands(NULL,0,BBPrd,BBDev,0,PRICE_CLOSE,MODE_LOWER,shift);
      TopSBand=SBMA + (SBFactor * iATR(NULL,0,SBATRPrd,shift+SBShift));
      BotSBand=SBMA - (SBFactor * iATR(NULL,0,SBATRPrd,shift+SBShift));
      TopBBandPrev=iBands(NULL,0,BBPrd,BBDev,0,PRICE_CLOSE,MODE_UPPER,shift+1);
      BotBBandPrev=iBands(NULL,0,BBPrd,BBDev,0,PRICE_CLOSE,MODE_LOWER,shift+1);
//----
      if (TopBBand<TopSBand && BotBBand>BotSBand) Squeeze[shift]=50;
      // ========= Squeeze Signals Ends
      // ========= BB Breakout Signals
      //if(Squeeze[shift+2]==50 && RSI[shift]>50 && BotBBand<BotSBand)
      if((Squeeze[shift+2]==50 || Squeeze[shift+1]==50) && RSI[shift]>50 && BotBBand<BotSBand)
        {
         Buy[shift]=ob;
         Sell[shift]=EMPTY_VALUE;
        }
      else
         //if(Squeeze[shift+2]==50 && RSI[shift]<50 && TopBBand>TopSBand)
         if((Squeeze[shift+2]==50 || Squeeze[shift+1]==50) && RSI[shift]<50 && TopBBand>TopSBand)
           {
            Buy[shift]=EMPTY_VALUE;
            Sell[shift]=os;
           }
         else
            if(Buy[shift+1]==ob && BotBBand<BotBBandPrev && RSI[shift]>50)
              {
               Buy[shift]=ob;
               Sell[shift]=EMPTY_VALUE;
              }
            else
               if(Sell[shift+1]==os && TopBBand>TopBBandPrev && RSI[shift]<50)
                 {
                  Buy[shift]=EMPTY_VALUE;
                  Sell[shift]=os;
                 }
               else
                 {
                  Buy[shift]=EMPTY_VALUE;
                  Sell[shift]=EMPTY_VALUE;
                 }
      // ========= BB Breakout Signals Ends
     }
   // ======= Alert =========
   if(AlertOn)
     {
      if(prevtime==Time[0])
        {
         return(0);
        }
      prevtime=Time[0];
      BuyNow=Buy[0];
      BuyPrevious=Buy[1];
      SellNow=Sell[0];
      SellPrevious=Sell[1];
//----
      if((BuyNow ==ob) && (BuyPrevious ==EMPTY_VALUE) )
        {
         Alert(Symbol(), " M", Period(), " Buy Alert");
        }
      else
         if((SellNow ==os) && (SellPrevious ==EMPTY_VALUE) )
           {
            Alert(Symbol(), " M", Period(), " Sell Alert");
           }
      IndicatorShortName("RSI("+RSIPeriod+") (Alert on)");
     }
   // ======= Alert Ends =========
   return(0);
  }
//+------------------------------------------------------------------+
Comments