MultiCharts
Download script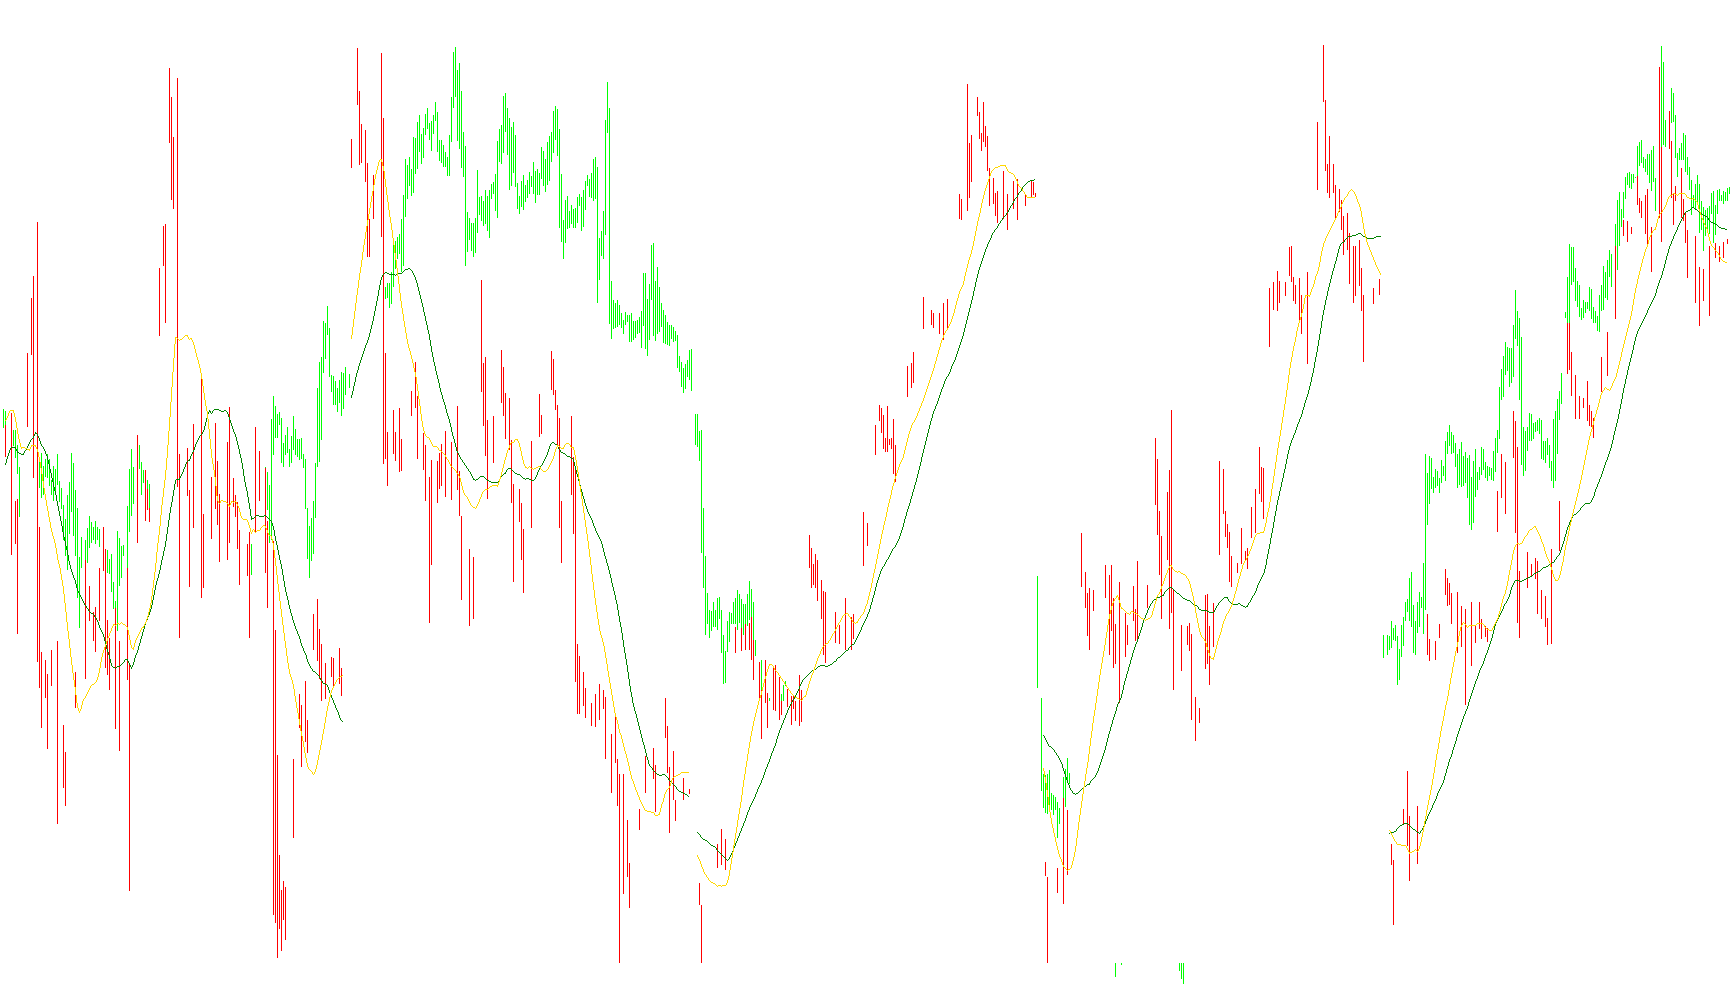
This script is a specialized multi-currency visual dashboard designed for the MetaTrader platform. Its primary purpose is to allow traders to monitor up to five different currency pairs (or assets) simultaneously within a single secondary window, rather than switching between multiple individual tabs.
Core Functionality
The logic operates by collecting real-time price data from several predefined symbols and "compressing" them into a unified visual display. Instead of showing full standard charts, it creates a summarized representation of each asset’s performance.
Key Features & Logic:
- Multi-Chart Consolidation: The script takes specific assets (e.g., EURUSD, GBPUSD, etc.) and tiles them side-by-side. It automatically calculates the necessary spacing and sizing so that the visual data for each currency fits neatly within the indicator window.
- Dynamic Data Rendering:
- Candlestick Representation: For each asset, the script draws a simplified version of the price action (High, Low, Open, and Close). It identifies "Bullish" or "Bearish" movements and colors them accordingly (typically White/Red or custom user colors).
- Heiken Ashi Compatibility: The logic includes an option to switch from standard price candles to Heiken Ashi candles, which are often used by traders to identify trend momentum more clearly.
- Technical Indicators:
- The script can overlay Moving Averages (Fast and Slow) onto these mini-representations. This allows you to see the trend of multiple currencies at a glance without needing to look at five different moving average lines on separate screens.
- Live Information Overlay:
- OHLC Data: It displays the exact current price values (Open, High, Low, Close) as text labels for each currency.
- Spread Tracking: It can show the current "spread" (the cost of trading that pair) in real-time next to the symbol name.
- Timeframe Labeling: It automatically detects and displays the current timeframe for each asset.
- Smart Refresh Logic:
- To ensure the platform runs smoothly, the script includes "New Bar" detection. It only updates the heavy visual data when a new candle forms or when the price moves significantly, preventing the terminal from lagging by constantly recalculating every millisecond.
- It also features a "Window Color" detection logic, which allows the indicator to adapt its appearance based on the background color of your trading workspace.
Summary for the User
Think of this script as a "Market Snapshot Dashboard." Instead of having five windows open on your monitor, this tool gathers the price action, moving averages, spreads, and OHLC data for five different currencies and paints them into one organized, easy-to-read display. It is designed to give you a high-level overview of the market's "pulse" in a single glance.
//+------------------------------------------------------------------+
//| MultiCharts.mq4 |
//| Copyright © 2009, Koss |
//| kosmic@inbox.ru |
//+------------------------------------------------------------------+
#property copyright "Copyright © 2009, Koss"
#property link "kosmic@inbox.ru"
#property indicator_separate_window
#property indicator_buffers 8
#property indicator_minimum -10
#property indicator_maximum 110
#import "user32.dll"
int GetWindowDC(int dc);
int ReleaseDC(int h, int dc);
bool GetWindowRect(int h, int& pos[4]);
/*int GetParent(int h);
int GetTopWindow(int h);*/
#import
#import "gdi32.dll"
int GetPixel(int dc, int x, int y);
#import
extern color BearCandle = Red;
extern color BullCandle = White;
extern color FastMA_Color = Gold;
extern int FastMA_Period = 21;
extern color SlowMA_Color = Green;
extern int SlowMA_Period = 38;
extern int MA_Metod = 0;
extern int Applied_Price = 0;
extern bool UseMovingAverages =true;
extern bool UseHeikenAshiChart =false;
extern bool ViewOHLC=true;
extern bool ViewSPREAD=true;
extern int Charts =5;
extern string Chart1 ="EURUSD";
extern string Chart2 ="GBPUSD";
extern string Chart3 ="AUDUSD";
extern string Chart4 ="USDCAD";
extern string Chart5 ="USDJPY";
//---- buffers
double ExtMapBuffer1[];
double ExtMapBuffer2[];
double ExtMapBuffer3[];
double ExtMapBuffer4[];
double ExtMapBuffer5[];
double ExtMapBuffer6[];
double SlowMABuffer[];
double FastMABuffer[];
//----
int CandelsCountOnWindow=0,
Frame,
hWnd,
Win_Charts,
CandleWidth,
HistoWidth,
MAWidth=1,
TimeFrame,
MA,
Ap_Price;
color Win_color;
double ChartValues[6][4];
static datetime ÒicTime[5],
ZeroBarTime[5];
int Hystory[5];
string Win_Name,
ChartNames[5];
string Periods[9][2] ={ "1", ",M1",
"5", ",M5",
"15", ",M15",
"30", ",M30",
"60", ",H1",
"240", ",H4",
"1440", ",Daily",
"10080", ",Weekly",
"43200", ",Monthly"};
bool StartTerminal=true;
double open,close,high,low,min,max,point,haopen, hahigh, halow, haclose,FastMA,SlowMA;
//+------------------------------------------------------------------+
//| Custom indicator initialization function |
//+------------------------------------------------------------------+
int init()
{
TimeFrame=Period();
Win_Name = "TFS";
IndicatorShortName(Win_Name);
DeleteChartNames();
Win_color = GetWndColor(Symbol());
CandleWidth = GetCandleWidth(Symbol());
if (Charts<1 || Charts>5) Win_Charts=5;
else Win_Charts = Charts;
if (MA_Metod<0 || MA_Metod>3) MA=0;
else MA=MA_Metod;
if (Applied_Price<0 || Applied_Price>6) Ap_Price=0;
else Ap_Price=Applied_Price;
if (!IsDllsAllowed())
{
Alert("Äëÿ íîðìàëüíîé ðàáîòû èíäèêàòîðà íåîáõîäèìî ðàçðåøèòü èìïîðò èç DLL");
return(0);
}
else
{
if (WindowBarsPerChart()!=0)
{
ChartsInit();
CandelsCountOnWindow=WindowBarsPerChart();
Frame = MathRound((CandelsCountOnWindow-3)/Win_Charts);
switch(CandleWidth)
{
case 1: HistoWidth=0;
MAWidth=1; break;
case 2: HistoWidth=0;
MAWidth=1; break;
case 4: HistoWidth=2;
MAWidth=1; break;
case 8: HistoWidth=3;
MAWidth=2; break;
case 16: HistoWidth=7;
MAWidth=2; break;
case 32: HistoWidth=13;
MAWidth=3; break;
}
IndicatorSets(false);
}
return(0);
}
}
//+------------------------------------------------------------------+
//| Custom indicator iteration function |
//+------------------------------------------------------------------+
int start()
{
if( WindowBarsPerChart()!=0 && Bars!=0 && AccountNumber()!=0)
{
if (StartTerminal)
{
CleanHisto();
LoadHystory();
}
if (!WndRepaint())
{
SymbolÒic();
}
StartTerminal=false;
}
else
{
init();
}
return(0);
}
//+------------------------------------------------------------------+
//|âîçâðàùàåò öâåò ôîíà îêíà òåêóùåãî ãðôèêà |
//+------------------------------------------------------------------+
int GetWndColor(string sy)
{
int hWnd = WindowHandle(sy, Period());
int hDC = GetWindowDC(hWnd);
int rect[4];
GetWindowRect(hWnd, rect);
int wW = rect[2] - rect[0]; // øèðèíà îêíà
int wH = rect[3] - rect[1]; // âûñîòà îêíà
int col = GetPixel(hDC, 2, 2);
if(col==-1) // ëåâûé âåðõíèé óãîë íå âèäåí
{
col = GetPixel(hDC, wW-3, wH-3);
if(col==-1) // ïðàâûé íèæíèé óãîë íå âèäåí
col = GetPixel(hDC, 2, wH-3);
if(col==-1) // ëåâûé íèæíèé óãîë íå âèäåí
col = GetPixel(hDC, wW-3, 2);
if(col==-1) // ïðàâûé âåðõíèé óãîë íå âèäåí
{
ReleaseDC(hWnd, hDC);
return(Win_color);
}
}
ReleaseDC(hWnd, hDC);
return(col);
}
void ChartsInit()
{
LoadChartsNames();
InitArrays();
}
void LoadChartsNames()
{
ChartNames[0]=Chart1;
ChartNames[1]=Chart2;
ChartNames[2]=Chart3;
ChartNames[3]=Chart4;
ChartNames[4]=Chart5;
}
void InitArrays()
{
for(int i=0;i<=Win_Charts-1;i++)
{
ZeroBarTime[i]=0;
ÒicTime[i]=0;
Hystory[i]=0;
continue;
}
}
void LoadChartsValues()
{
for(int i=0;i<=Win_Charts-1;i++)
{
UpgradeCharts(i);
continue;
}
}
void LoadHystory()
{
for(int i=0;i<=Win_Charts-1;i++)
{
Hystory[i]=RefreshRate(i);
continue;
}
}
void UpgradeCharts(int ChartListPosition)
{
int j;
double min,max;
string Symb=ChartNames[ChartListPosition];
if (Hystory[ChartListPosition]==1)
{
max=iHigh(Symb,0,0);
min=iLow(Symb,0,0);
for (j=0;j<=Frame-2;j++)
{
if (iHigh(Symb,0,j)>max)
{
max=iHigh(Symb,0,j);
}
if (iLow(Symb,0,j)<min)
{
min=iLow(Symb,0,j);
}
}
ChartValues[ChartListPosition+1,1]=((max-min)/100);
ChartValues[ChartListPosition+1,2]= max;
ChartValues[ChartListPosition+1,3]= min;
CleanFrame(ChartListPosition+1);
DrawChart(ChartListPosition);
DrawSeparateLines(ChartListPosition);
ChartName(ChartListPosition);
if (ViewOHLC) OHLC(ChartListPosition);
}
else
{
ChartValues[ChartListPosition+1,1]=0;
ChartValues[ChartListPosition+1,2]=0;
ChartValues[ChartListPosition+1,3]=0;
CleanFrame(ChartListPosition+1);
ChartName(ChartListPosition);
DrawSeparateLines(ChartListPosition);
}
ChartValues[0,0]=ChartListPosition+1;
}
//+------------------------------------------------------------------+
//|Îáíîâëåíèå äàííûõ |
//+------------------------------------------------------------------+
int RefreshRate(int ChartListPosition)
{
string Symb=ChartNames[ChartListPosition];
datetime times[];
int error;
ArrayCopySeries(times,MODE_TIME,Symb,0);
error=GetLastError();
if(error==4066)
{
return(0);
}
if((iTime(Symb,0,0)==times[0] && iTime(Symb,0,0)==Time[0])&&
(iTime(Symb,0,1)==times[1] && iTime(Symb,0,1)==Time[1])&&
(iTime(Symb,0,2)==times[2] && iTime(Symb,0,2)==Time[2]) ) return(1);
}
//+------------------------------------------------------------------+
//|îòðèñîâêà íàçâàíèé èíñòðóìåíòîâ è ïðî÷èõ íàäïèñåé |
//+------------------------------------------------------------------+
void ChartName(int ChartListPosition)
{
int k=MathRound(Frame/2);
if (ChartListPosition==0)
{
DrawChartsName(ChartListPosition,k);
}
else
{
DrawChartsName(ChartListPosition,k+ChartListPosition*Frame);
}
}
void DrawChartsName(int ChartListPosition,int Bar)
{
string TF,name,spread,Symb=ChartNames[ChartListPosition];
for(int p=0; p<9; p++)
{
if(Periods[p][0]==DoubleToStr(TimeFrame,0)) TF=Periods[p][1];
}
name="Chart"+Symb;
if (ViewSPREAD) spread=" (spr "+DoubleToStr(MarketInfo(Symb,MODE_SPREAD),0)+")";
else spread=" ";
if (!UseHeikenAshiChart)
{
CleanChartsName(ChartListPosition);
CleanUpdateText(ChartListPosition);
CreateTextObject(name, Time[Bar],108,Symb+TF+spread,BullCandle,Bar,"tahoma",7);
if (Hystory[ChartListPosition]==0 || !IsConnected())
{
CreateTextObject("Update "+name, Time[Bar],55,"ÎÆÈÄÀÍÈÅ ÎÁÍÎÂËÅÍÈß...",BullCandle,Bar,"tahoma",7);
}
}
else
{
CleanChartsName(ChartListPosition);
CleanUpdateText(ChartListPosition);
CreateTextObject(name, Time[Bar],108,Symb+TF+" (HA)",BullCandle,Bar,"tahoma",7);
if (Hystory[ChartListPosition]==0 || !IsConnected())
{
CreateTextObject("Update "+name, Time[Bar],55,"ÎÆÈÄÀÍÈÅ ÎÁÍÎÂËÅÍÈß...",BullCandle,Bar,"tahoma",7);
}
}
}
void OHLC(int ChartListPosition)
{
int k=MathRound(Frame/2);
if (ChartListPosition==0)
{
DrawOHLC(ChartListPosition,k);
}
else
{
DrawOHLC(ChartListPosition,k+ChartListPosition*Frame);
}
}
void DrawOHLC(int ChartListPosition,int Bar)
{
double dig,high,open,low,close,Zlow,Zhigh;
string Symb=ChartNames[ChartListPosition],ohlc,name;
name="OHLC "+Symb;
RefreshRates();
dig=MarketInfo(Symb,MODE_DIGITS);
if (!UseHeikenAshiChart)
{
high=NormalizeDouble(Hi(Symb,0,0),dig);
open=NormalizeDouble(Op(Symb,0,0),dig);
close=NormalizeDouble(Cl(Symb,0,0),dig);
low=NormalizeDouble(Lo(Symb,0,0),dig);
ohlc=DoubleToStr(open,dig)+" "+DoubleToStr(high,dig)+" "+DoubleToStr(low,dig)+" "+DoubleToStr(close,dig);
CleanOHLC(ChartListPosition);
CreateTextObject(name, Time[Bar],-2,ohlc,BullCandle,Bar,"tahoma",8);
}
else
{
high=NormalizeDouble(Hi(Symb,0,0),dig);
low=NormalizeDouble(Lo(Symb,0,0),dig);
open=iCustom(Symb,0,"Heiken Ashi",2,0);
close=iCustom(Symb,0,"Heiken Ashi",3,0);
Zhigh=MathMax(high, MathMax(open, close));
Zlow=MathMin(low, MathMin(open, close));
ohlc=DoubleToStr(open,dig)+" "+DoubleToStr(Zhigh,dig)+" "+DoubleToStr(Zlow,dig)+" "+DoubleToStr(close,dig);
CleanOHLC(ChartListPosition);
CreateTextObject(name, Time[Bar],-2,ohlc,BullCandle,Bar,"tahoma",8);
}
}
void CleanOHLC(int ChartListPosition)
{
string name;
name=StringConcatenate("OHLC ",ChartNames[ChartListPosition]);
ObjectDelete(name);
}
void CleanChartsName(int ChartListPosition)
{
string name;
name=StringConcatenate("Chart",ChartNames[ChartListPosition]);
ObjectDelete(name);
}
void CleanUpdateText(int ChartListPosition)
{
string name,name1;
name1="Chart"+ChartNames[ChartListPosition];
name=StringConcatenate("Update ",name1);
ObjectDelete(name);
}
//+------------------------------------------------------------------+
//|óäàëåíèå ãðàôèêà îïðåäåëåííîãî èíñòðóìåíòà |
//+------------------------------------------------------------------+
void CleanFrame(int ChartListPosition)
{
int i;
if (ChartListPosition==1)
{
if (ChartListPosition!=Win_Charts)
{
for(i=0;i<=Frame-1;i++)
{
CleanBuffers(i);
}
}
else
{
for(i=0;i<=Bars;i++)
{
CleanBuffers(i);
}
}
}
else
{
if (ChartListPosition!=Win_Charts)
{
for(i=ChartListPosition*Frame-1;i>=(ChartListPosition-1)*Frame;i--)
{
CleanBuffers(i);
}
}
else
{
for(i=(ChartListPosition-1)*Frame;i<=Bars;i++)
{
CleanBuffers(i);
}
}
}
}
//+------------------------------------------------------------------+
//|ôóíêöèÿ ñëåæåíèÿ çà èçìåíåíèÿìè îêíà òåêóùåãî ãðàôèêà |
//+------------------------------------------------------------------+
bool WndRepaint()
{
if ( Win_color != GetWndColor(Symbol()) ||
CandleWidth != GetCandleWidth(Symbol()) ||
CandelsCountOnWindow!=WindowBarsPerChart() )
{
CleanHisto();
CandelsCountOnWindow=WindowBarsPerChart();
Frame = MathRound((CandelsCountOnWindow-3)/Win_Charts);
Win_color = GetWndColor(Symbol());
CandleWidth=GetCandleWidth(Symbol());
switch(CandleWidth)
{
case 1: HistoWidth=0;
MAWidth=1; break;
case 2: HistoWidth=0;
MAWidth=1; break;
case 4: HistoWidth=2;
MAWidth=1; break;
case 8: HistoWidth=3;
MAWidth=2; break;
case 16: HistoWidth=7;
MAWidth=2; break;
case 32: HistoWidth=13;
MAWidth=3; break;
}
IndicatorSets(true);
return(true);
}
return(false);
}
//+------------------------------------------------------------------+
//|óñòàíîâêè èíäèêàòîðà |
//+------------------------------------------------------------------+
void IndicatorSets(bool Repaint)
{
/*ArrayInitialize(ChartValues,0.0); */
SetIndexStyle(0,DRAW_HISTOGRAM, 0, HistoWidth, BearCandle);
SetIndexBuffer(0, ExtMapBuffer1);
SetIndexDrawBegin(0,Bars-CandelsCountOnWindow-4);
SetIndexLabel(0,"");
SetIndexStyle(1,DRAW_HISTOGRAM, 0, HistoWidth, BullCandle);
SetIndexBuffer(1, ExtMapBuffer2);
SetIndexDrawBegin(1,Bars-CandelsCountOnWindow-4);
SetIndexLabel(1,"");
SetIndexStyle(2,DRAW_HISTOGRAM, 0, HistoWidth, Win_color);
SetIndexBuffer(2, ExtMapBuffer3);
SetIndexDrawBegin(2,Bars-CandelsCountOnWindow-4);
SetIndexLabel(2,"");
SetIndexStyle(3,DRAW_HISTOGRAM, 0, 1, BearCandle);
SetIndexBuffer(3, ExtMapBuffer4);
SetIndexDrawBegin(3,Bars-CandelsCountOnWindow-4);
SetIndexLabel(3,"");
SetIndexStyle(4,DRAW_HISTOGRAM, 0, 1, BullCandle);
SetIndexBuffer(4, ExtMapBuffer5);
SetIndexDrawBegin(4,Bars-CandelsCountOnWindow-4);
SetIndexLabel(4,"");
SetIndexStyle(5,DRAW_HISTOGRAM, 0, 1, Win_color);
SetIndexBuffer(5, ExtMapBuffer6);
SetIndexDrawBegin(5,Bars-CandelsCountOnWindow-4);
SetIndexLabel(5,"");
SetIndexStyle(6,DRAW_LINE, 0, MAWidth, SlowMA_Color);
SetIndexBuffer(6, SlowMABuffer);
SetIndexDrawBegin(6,Bars-CandelsCountOnWindow-4);
SetIndexLabel(6,"");
SetIndexStyle(7,DRAW_LINE,0,MAWidth,FastMA_Color);
SetIndexBuffer(7, FastMABuffer);
SetIndexDrawBegin(7,Bars-CandelsCountOnWindow-4);
SetIndexLabel(7,"");
if (Repaint)
{
DeleteChartNames();
LoadChartsValues();
}
}
//+------------------------------------------------------------------+
//|óäàëåíèå âñåõ íàäïèñåé |
//+------------------------------------------------------------------+
void DeleteChartNames()
{
int ChartWindow;
ChartWindow=WindowFind(Win_Name);
if (ChartWindow!=-1) ObjectsDeleteAll(ChartWindow,OBJ_TEXT);
}
//+------------------------------------------------------------------+
//|Âîçâðàùàåò øèðèíó áàðà |
//+------------------------------------------------------------------+
int GetCandleWidth(string sy)
{
int rect[4];
int h=WindowHandle(sy, Period());
if(h==0) return(-1);
GetWindowRect(h, rect);
int wW = rect[2] - rect[0]; // øèðèíà îêíà
int bpc = CandelsCountOnWindow;
if(bpc==0) return(-1);
return(MathFloor((wW-48)/bpc));
}
/*bool isActive(string sy)
{
int hCurrWindow = WindowHandle(sy,0); //õåäë òåêóùåãî îêíà ãðàôèêà
int hNextParent = GetParent(hCurrWindow);
hNextParent = GetParent(hNextParent); //õåíäï ðîäèòåëüñêîãî îêíî äëÿ âñåõ ãðàôèêîâ
int hNextActiveWindow = GetTopWindow(hNextParent);
hNextActiveWindow = GetTopWindow(hNextActiveWindow); //õåäë òåêóùåãî îêíà ãðàôèêà
if (hCurrWindow==hNextActiveWindow) return(true);
else return(false);
} */
double Op(string Symb,int period,int Bar)
{
return(iOpen(Symb,period,Bar));
}
double Cl(string Symb,int period,int Bar)
{
return(iClose(Symb,period,Bar));
}
double Hi(string Symb,int period,int Bar)
{
return(iHigh(Symb,period,Bar));
}
double Lo(string Symb,int period,int Bar)
{
return(iLow(Symb,period,Bar));
}
//+------------------------------------------------------------------+
//|ôóíêöèÿ î÷èñòêè èíäèêàòîðíûõ ìàññèâîâ |
//+------------------------------------------------------------------+
void CleanBuffers(int i)
{
ExtMapBuffer1[i]=EMPTY_VALUE;
ExtMapBuffer2[i]=EMPTY_VALUE;
ExtMapBuffer3[i]=EMPTY_VALUE;
ExtMapBuffer4[i]=EMPTY_VALUE;
ExtMapBuffer5[i]=EMPTY_VALUE;
ExtMapBuffer6[i]=EMPTY_VALUE;
SlowMABuffer[i]=EMPTY_VALUE;
FastMABuffer[i]=EMPTY_VALUE;
}
//+------------------------------------------------------------------+
//|ïðîðèñîâêà èíñòðóìåíòà |
//+------------------------------------------------------------------+
void DrawChart(int ChartListPosition)
{
int j;
for(j=Frame-4;j>=0;j--)
{
SetValues(j,ChartListPosition);
}
}
void DrawZeroBar(int ChartListPosition)
{
double Zmin,Zmax,LastPrice;
string Symb=ChartNames[ChartListPosition];
LastPrice=MarketInfo(Symb,MODE_BID);
Zmin=ChartValues[ChartListPosition+1][3];
Zmax=ChartValues[ChartListPosition+1][2];
if (LastPrice<Zmin || LastPrice>Zmax)
{
UpgradeCharts(ChartListPosition);
}
SetValues(0,ChartListPosition);
}
void SetValues(int Bar,int ChartListPosition)
{
string Symb=ChartNames[ChartListPosition];
min=ChartValues[ChartListPosition+1][3];
point=ChartValues[ChartListPosition+1][1];
if (!UseHeikenAshiChart)
{
open = (Op(Symb,0,Bar)-min)/point;
close= (Cl(Symb,0,Bar)-min)/point;
high = (Hi(Symb,0,Bar)-min)/point;
low = (Lo(Symb,0,Bar)-min)/point;
if (UseMovingAverages)
{
FastMA=(iMA(Symb,0,FastMA_Period,0,MA,Ap_Price,Bar)-min)/point;
if (FastMA<0 || FastMA>100)
{
FastMA=EMPTY_VALUE;
}
SlowMA=(iMA(Symb,0,SlowMA_Period,0,MA,Ap_Price,Bar)-min)/point;
if (SlowMA<0 || SlowMA>100)
{
SlowMA=EMPTY_VALUE;
}
}
else
{
FastMA=EMPTY_VALUE;
SlowMA=EMPTY_VALUE;
}
if (ChartListPosition==0)
{
DrawHisto(open,high,low,close,FastMA,SlowMA,Bar+2);
}
else
{
DrawHisto(open,high,low,close,FastMA,SlowMA,Bar+ChartListPosition*Frame+2);
}
}
else
{
high = (Hi(Symb,0,Bar)-min)/point;
low = (Lo(Symb,0,Bar)-min)/point;
haopen=(iCustom(Symb,0,"Heiken Ashi",2,Bar)-min)/point;
haclose=(iCustom(Symb,0,"Heiken Ashi",3,Bar)-min)/point;
hahigh=MathMax(high, MathMax(haopen, haclose));
halow=MathMin(low, MathMin(haopen, haclose));
FastMA=EMPTY_VALUE;
SlowMA=EMPTY_VALUE;
if (ChartListPosition==0)
{
DrawHisto(haopen,hahigh,halow,haclose,FastMA,SlowMA,Bar+2);
}
else
{
DrawHisto(haopen,hahigh,halow,haclose,FastMA,SlowMA,Bar+ChartListPosition*Frame+2);
}
}
}
//+------------------------------------------------------------------+
//| Óäàëåíèå âñåõ ÷àðòîâ |
//+------------------------------------------------------------------+
void CleanHisto()
{
if (Bars!=0)
{
for(int i=0;i<=Bars-1;i++)
{
CleanBuffers(i);
continue;
}
}
}
//+------------------------------------------------------------------+
//|ïðîðèñîâêà ðàçäåëèòåëüíûõ ëèíèé |
//+------------------------------------------------------------------+
void DrawSeparateLines(int ChartListPosition)
{
int value;
value=ChartListPosition*Frame;
if (ChartListPosition==Win_Charts-1)
{
ExtMapBuffer5[value]=100;
value+=Frame;
ExtMapBuffer5[value]=100;
}
else
{
ExtMapBuffer5[value]=100;
}
}
//+------------------------------------------------------------------+
//|çàïîëíåíèå èíäèêàòîðíûõ ìàññèâîâ |
//+------------------------------------------------------------------+
void DrawHisto(double O,double H,double L,double C,double ma,double ma1,int Bar)
{
if (O > C)
{
ExtMapBuffer1[Bar]=O;
ExtMapBuffer2[Bar]=EMPTY_VALUE;
ExtMapBuffer3[Bar]=C;
ExtMapBuffer4[Bar]=H;
ExtMapBuffer5[Bar]=EMPTY_VALUE;
}
if (O < C)
{
ExtMapBuffer1[Bar]=EMPTY_VALUE;
ExtMapBuffer2[Bar]=C;
ExtMapBuffer3[Bar]=O;
ExtMapBuffer4[Bar]=EMPTY_VALUE;
ExtMapBuffer5[Bar]=H;
}
if (O == C)
{
ExtMapBuffer1[Bar]=O;
ExtMapBuffer2[Bar]=EMPTY_VALUE;
ExtMapBuffer3[Bar]=O;
ExtMapBuffer4[Bar]=EMPTY_VALUE;
ExtMapBuffer5[Bar]=H;
}
ExtMapBuffer6[Bar]=L;
FastMABuffer[Bar]=ma;
SlowMABuffer[Bar]=ma1;
}
//+------------------------------------------------------------------+
//| Ñîçäàåò îáúåêò-òåêñò |
//+------------------------------------------------------------------+
void CreateTextObject(string obj, double x, double y,string Text,color cl,int Bar,string FontName,int FontSize)
{
int ChartWindow;
ChartWindow=WindowFind(Win_Name);
ObjectCreate(obj, OBJ_TEXT, ChartWindow, x, y);
ObjectSetText(obj,Text,FontSize, FontName, cl);
}
//+------------------------------------------------------------------+
//|âîçâðàùàåò ïðèçíàê ïîÿâëåíèÿ íîâîãî áàðà äëÿ òåêóùåãî èíñòðóìåíòà |
//+------------------------------------------------------------------+
bool isNewBar(int ChartsListPosition)
{
bool res=false;
RefreshRates();
string Symb=ChartNames[ChartsListPosition];
datetime BT=iTime(Symb,0,0);
if ( ZeroBarTime[ChartsListPosition] !=BT || ZeroBarTime[ChartsListPosition] ==0 )
{
ZeroBarTime[ChartsListPosition] = BT;
res=true;
}
return(res);
}
bool isNewÒic(int ChartsListPosition)
{
bool res=false;
RefreshRates();
string Symb=ChartNames[ChartsListPosition];
datetime TT = MarketInfo(Symb,MODE_TIME);
if ( ÒicTime[ChartsListPosition] != TT )
{
ÒicTime[ChartsListPosition] = TT ;
res=true;
}
return(res);
}
void SymbolÒic()
{
for(int i=0; i<=Win_Charts-1; i++)
{
if (Hystory[i]==0)
{
Hystory[i]=RefreshRate(i);
}
else
{
if (!StartTerminal)
{
if (isNewÒic(i))
{
if (isNewBar(i))
{
LoadChartsValues();
}
else
{
DrawZeroBar(i);
if (ViewOHLC) OHLC(i);
}
}
}
}
continue;
}
}
Comments