MTF_AMA_SLOPE_v2L
Download script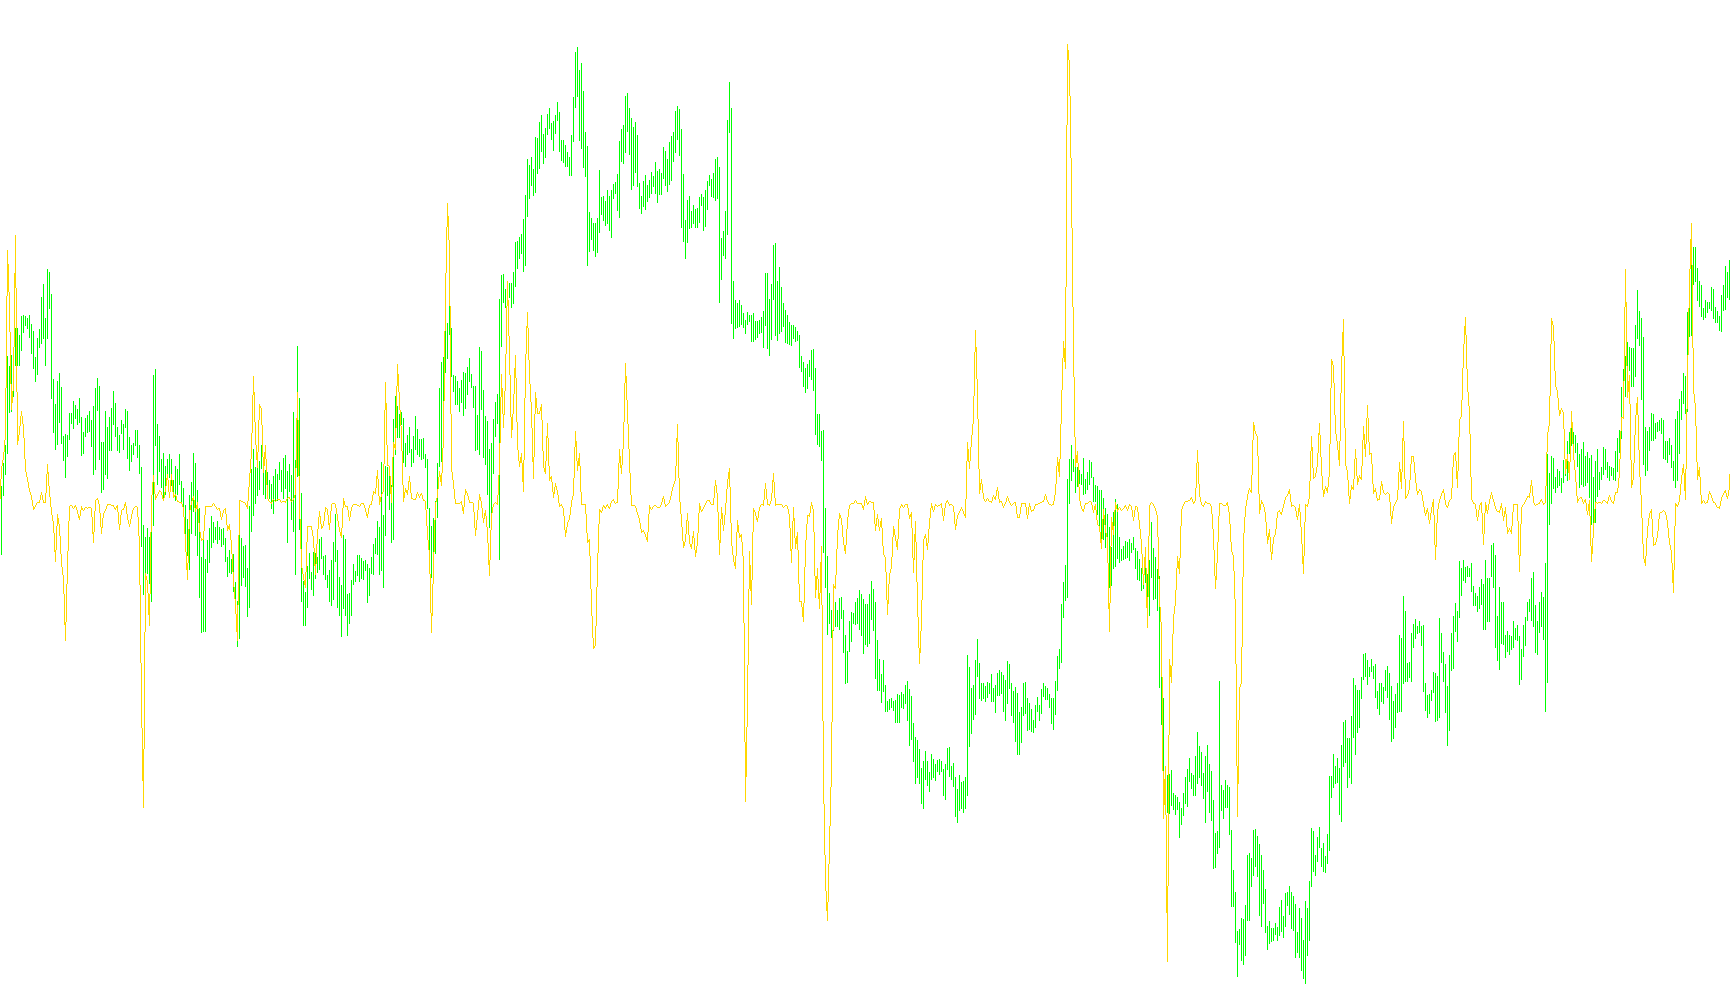
This tool is designed to provide traders with a visual representation of market momentum by analyzing the "slope" or angle of a specific smoothed moving average. Rather than simply showing a price line, it focuses on the direction and intensity of price movement across different time horizons.
Core Logic Overview
The primary objective of this script is to take complex data from a larger timeframe (such as Daily or Hourly charts) and project it onto your current smaller timeframe (such as 15-minute or 5-minute charts). This allows you to see the "big picture" trend without having to constantly switch back and forth between different screens.
Key Technical Features
- Multi-Timeframe Integration: The script automatically fetches data from a higher timeframe that you select. It aligns this data with your current view, ensuring that the visual information is synchronized correctly with the price action on your screen.
- Advanced Smoothing: It utilizes a variation of a smoothed moving average (based on Kaufman’s concepts). This means it filters out "market noise"—those small, erratic price fluctuations—to reveal the underlying trend more clearly.
- Slope Analysis: Instead of looking at where the price is currently sitting, the indicator calculates the trajectory of the move. By highlighting the slope, it helps traders identify whether the momentum is strengthening, weakening, or reversing.
- Visual Continuity: To ensure the data looks smooth and readable on your chart, the script includes a "refresh" logic. If you are viewing a small timeframe (like 1-minute), it ensures that the data from the larger timeframe remains steady and continuous across all visible bars, preventing gaps or jagged jumps in the line.
How It Benefits the User
This tool serves as a trend-following guide. By observing the slope, a user can determine the dominant market direction. Because it pulls from a higher timeframe, it helps prevent the common mistake of "trading against the tide"—allowing you to see if a short-term move is just a minor correction within a larger, overarching trend.
//+------------------------------------------------------------------+
//|                   MTF_AMA_SLOPE                    AMA SLOPE.mq4 |
//|                   2007   forexTSD.com             2006   Kalenzo |
//|                                     bartlomiej.gorski@gmail.com  |
//| I used the idea of P.Kauffman and code from KAMA             idk |
//| made by © 2004, by konKop,wellx                                  |
//+------------------------------------------------------------------+
#property copyright "Kalenzo"
#property link      "bartlomiej.gorski@gmail.com"

#property indicator_separate_window
#property indicator_buffers 1
#property indicator_color1 Brown
#property indicator_width1 2

//---- input parameters
extern int TimeFrame = 0;
extern int       periodAMA=9;
extern int       nfast=2;
extern int       nslow=30;
extern double    G=2.0;

//---- buffers
//double kAMAbuffer[];
double ExtMapBuffer1[];

//+------------------------------------------------------------------+

//int    cbars=0, prevbars=0, prevtime=0;

//double slowSC,fastSC;

//+------------------------------------------------------------------+
//| Custom indicator initialization function                         |
//+------------------------------------------------------------------+
int init()
  {
//---- indicators
   SetIndexStyle(0,DRAW_LINE);
   SetIndexBuffer(0,ExtMapBuffer1);
   SetIndexLabel(0,"["+TimeFrame+"]("+periodAMA+")("+nfast+","+nslow+","+G+")");

   IndicatorDigits(4);
//   IndicatorShortName("MTF_AMA_Slope");
  // return(0);
 // }
//+------------------------------------------------------------------+
//| Custom indicator deinitialization function                       |
//+------------------------------------------------------------------+
//int deinit()
 // {
 //  return(0);
 // }
//+------------------------------------------------------------------+
//| Custom indicator iteration function                              |
//+------------------------------------------------------------------+
//---- name for DataWindow and indicator subwindow label
   switch(TimeFrame)
   {
      case 1 : string TimeFrameStr="Period_M1"; break;
      case 5 : TimeFrameStr="Period_M5"; break;
      case 15 : TimeFrameStr="Period_M15"; break;
      case 30 : TimeFrameStr="Period_M30"; break;
      case 60 : TimeFrameStr="Period_H1"; break;
      case 240 : TimeFrameStr="Period_H4"; break;
      case 1440 : TimeFrameStr="Period_D1"; break;
      case 10080 : TimeFrameStr="Period_W1"; break;
      case 43200 : TimeFrameStr="Period_MN1"; break;
      default : TimeFrameStr="Current Timeframe";
   }

IndicatorShortName("MTF_AMA_SLOPE["+TimeFrameStr+"]("+periodAMA+")("+nfast+","+nslow+")");

//---- initialization done
   return(0);
  }
//+------------------------------------------------------------------+
//| Calculations                                    |
//+------------------------------------------------------------------+
int start()
  {
   datetime TimeArray[];
   int    i,shift,limit,y=0,counted_bars=IndicatorCounted();

// Plot defined timeframe on to current timeframe
   ArrayCopySeries(TimeArray,MODE_TIME,Symbol(),TimeFrame);

   limit=Bars-counted_bars+TimeFrame/Period();
   for(i=0,y=0;i<limit;i++)
   {
   if (Time[i]<TimeArray[y]) y++;
//---- main loop
    ExtMapBuffer1[i]=iCustom(NULL,TimeFrame,"AMA_SLOPE_v2",periodAMA,nfast,nslow,G, 0,y);
}
  // Refresh buffers
//++++++++++++++++++++++++++++++++++++++   upgrade by Raff
   if (TimeFrame>Period()) {
     int PerINT=TimeFrame/Period()+1;
     datetime TimeArr[]; ArrayResize(TimeArr,PerINT);
     ArrayCopySeries(TimeArr,MODE_TIME,Symbol(),Period());
     for(i=0;i<PerINT+1;i++) {if (TimeArr[i]>=TimeArray[0]) {
//----
 /********************************************************
    Refresh buffers:         buffer[i] = buffer[0];
 ********************************************************/

   ExtMapBuffer1[i]=ExtMapBuffer1[0];
//----
   } } }
//+++++++++++++++++++++++++++++++++++++++++++++++   Raff

//-----

return(0);
  }
//+------------------------------------------------------------------+
Comments