mt4_Pathfinder
Download script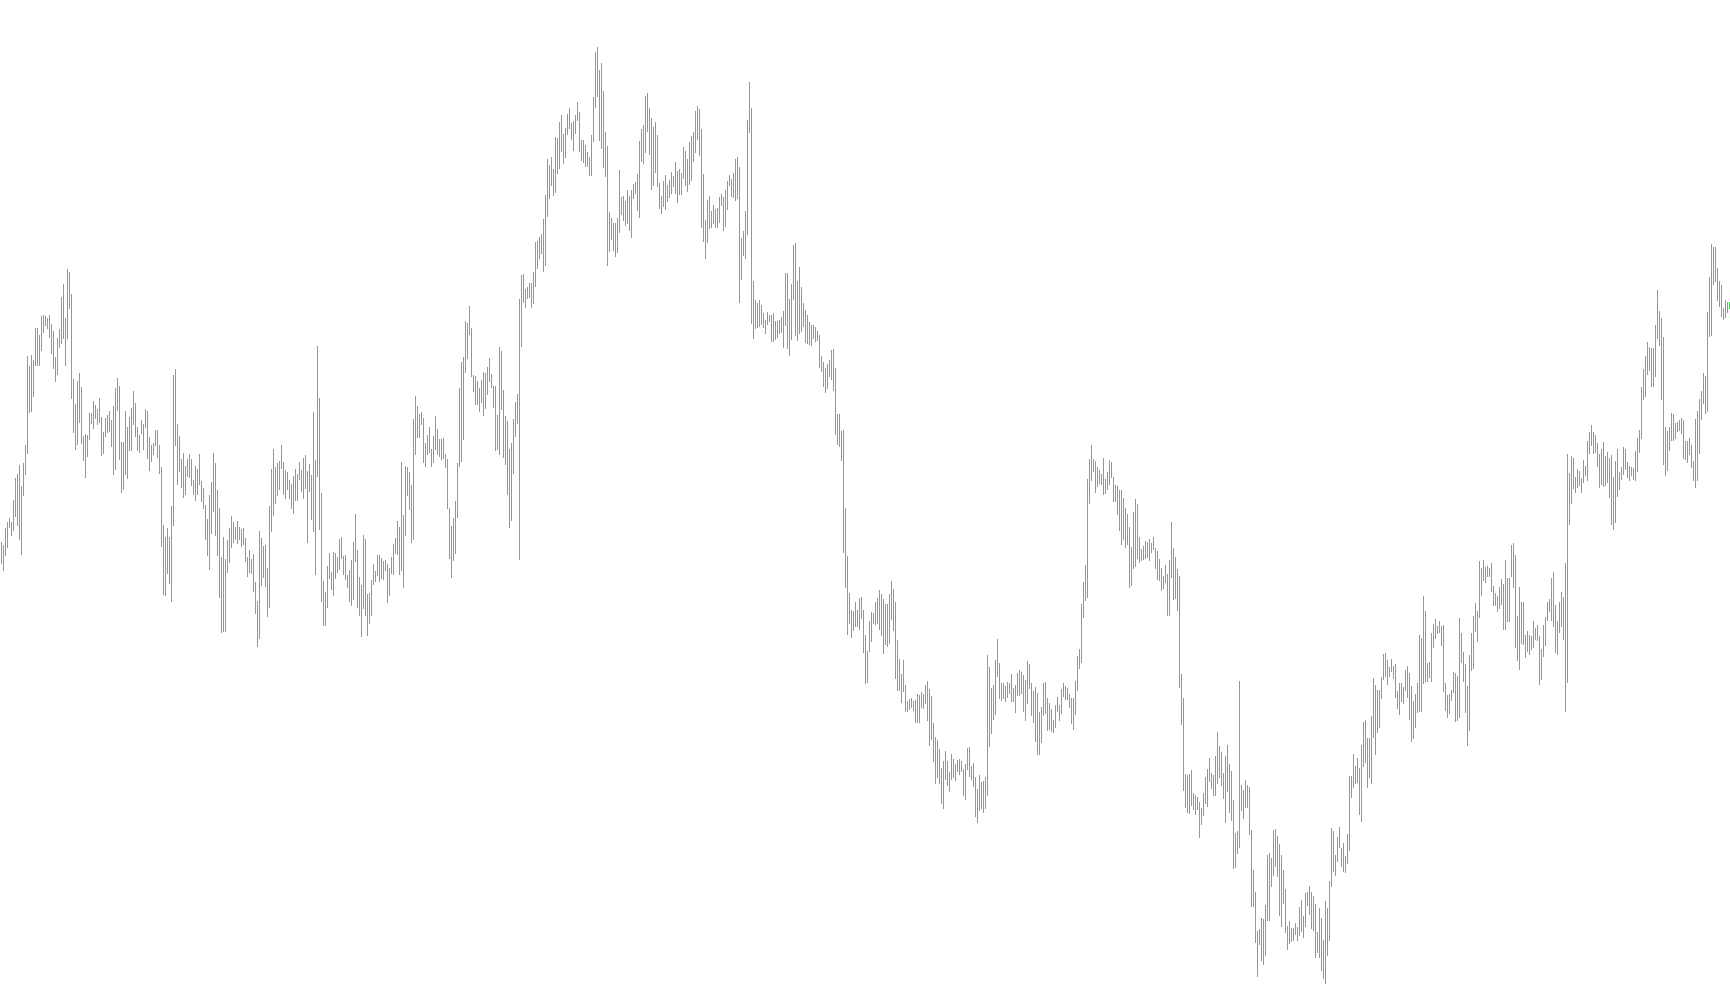
This tool, titled Pathfinder, is designed to provide traders with a multi-dimensional view of market momentum by simultaneously monitoring two different timeframes. Instead of looking at the price action alone, it focuses on identifying "Relative Strength" trends across various intervals to help users detect potential shifts in market direction.
Core Functionality
The script functions as a visual overlay that tracks and displays data from two specific timeframes: the 30-minute (M30) and the 1-hour (H1) periods. By pulling this information into a single view, it allows you to see how short-term movements correlate with longer-term trends.
How It Works
The logic operates by calculating and plotting two distinct lines on your chart:
- Short-Term Momentum (Silver Line): This represents the Relative Strength Level for the 30-minute timeframe. It provides a high-frequency look at the current market "pulse," helping you identify immediate fluctuations.
- Long-Term Trend (Orange Line): This tracks the Relative Strength Level for the 1-hour timeframe. It acts as a broader filter, showing you the primary direction of the market over a larger window of time.
Key Benefits for Trading
By visualizing these two data points together, the script helps users achieve several objectives:
- Contextual Awareness: You can see if a short-term move is supported by the larger trend or if it is a temporary deviation.
- Trend Alignment: It makes it easier to identify "confluence," which occurs when both the 30-minute and 1-hour levels are moving in the same direction, often signaling a stronger market move.
- Simplified Analysis: Rather than constantly switching between different charts or tabs to check various timeframes, this script consolidates that information into one window, allowing for faster decision-making.
//--------------------------------------------------------------------
// Pathfinder
// Search and destroy
// Multi Timeframe RSL Tests
//--------------------------------------------------------------------
#property indicator_separate_window    // Indicator is drawn in the main window
#property indicator_buffers 2         // Number of buffers
#property indicator_color1 Silver      // Buf_0 M30 RSL
#property indicator_color2 Orange      // Buf_1 H1 RSL


double Buf_0[],Buf_1[];

//--------------------------------------------------------------------
int init()                          // Special function init()
  {
//--------------------------------------------------------------------
   SetIndexBuffer(0,Buf_0);         // M30 RSL
   SetIndexStyle (0,DRAW_LINE,STYLE_SOLID,1);// Line style
//--------------------------------------------------------------------
   SetIndexBuffer(1,Buf_1);         // H1 RSL
   SetIndexStyle (1,DRAW_LINE,STYLE_SOLID,1);// Line style
//--------------------------------------------------------------------


  }

int start()
  {
   int i,counted_bars=IndicatorCounted(),n;

//----
   i=Bars;
      if(counted_bars<1) i=0;

   while(i>=0)
     {

//-------RSL für Timeframe 30 zeichnen
         double RSLm30=iCustom(NULL,PERIOD_M30,"mt4_PF_RSL_30m",26,0,i);
         Buf_0[i]=RSLm30;
//------------------------------------

//-------RSL für Timeframe 60 zeichnen
         double RSLm60=iCustom(PERIOD_H1, 0, "mt4_PF_RSL_60m",26,1,i);
         Buf_1[i+n]=RSLm60;
//------------------------------------


          i--;
     }
   return(0);
  }
//+------------------------------------------------------------------+
Comments