MRO2_v2
Download script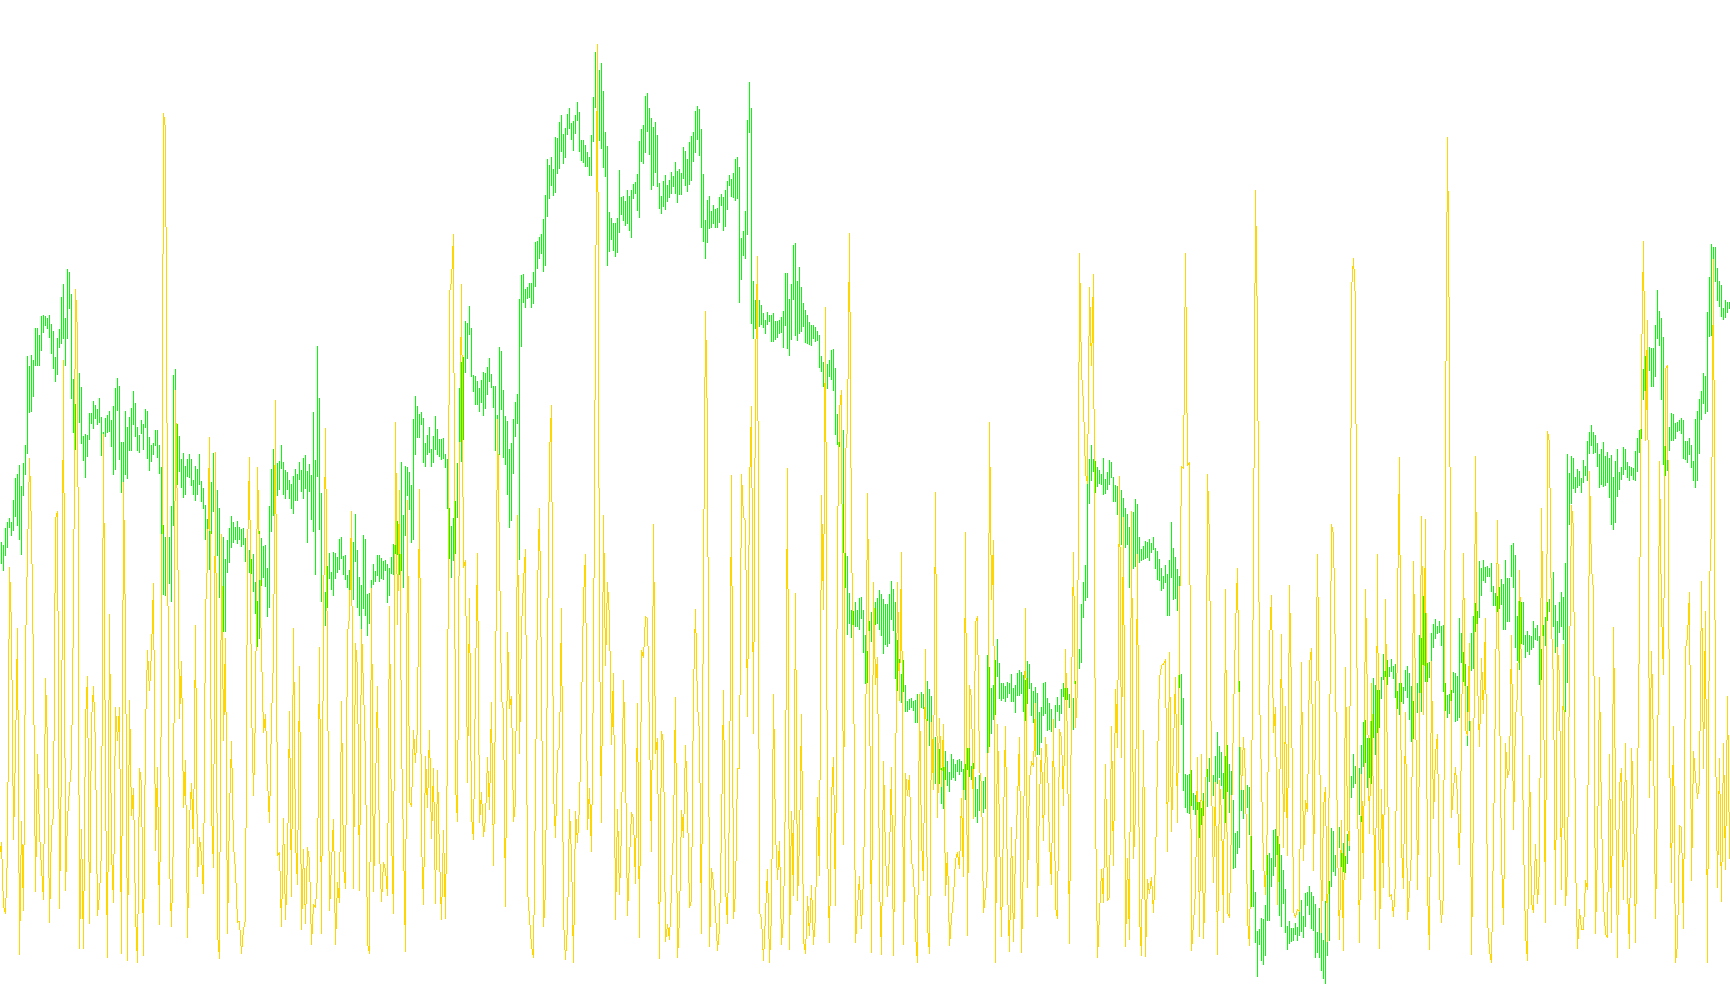
This script is a custom technical analysis tool designed to help traders visualize and measure price volatility relative to recent market activity. Instead of looking at raw price movements, it calculates a specialized ratio that helps identify whether the current price change is significant compared to the "normal" behavior of the market.
Core Logic Overview
The indicator operates by analyzing the relationship between two different types of price data: absolute range and recent price momentum.
Here is how the logic flows step-by-step:
1. Establishing the Baseline (Volatility) The script first looks at a specific window of time (defined by the user as a period, such as 7 bars). Within this window, it calculates the total "range" for every single bar—which is simply the distance between the highest price and the lowest price reached during that timeframe. It then averages these distances to create a baseline of how much the market typically moves in your chosen timeframe.
2. Measuring Recent Movement Simultaneously, the script looks at the actual closing prices over a specific span (specifically comparing the close of the previous bar against a price from four bars prior). This represents the "momentum" or the net movement that occurred recently.
3. Calculating the Final Value The final result displayed on your chart is the ratio between that recent momentum and the average volatility baseline.
What This Means for the Trader
By dividing the recent price movement by the average range, the script produces a normalized value.
- If the resulting value is high, it suggests that the current price move is much larger than what is typical for this specific period, potentially indicating a breakout or a surge in momentum.
- If the value is low, it suggests that price movements are currently staying within the "normal" bounds of the market's recent history.
In essence, this tool filters out the "noise" of the market to show you how intense the current price action is relative to the standard fluctuations of the past few bars.
//+------------------------------------------------------------------+
//|                                                         MRO2.mq4 |
//|                      Copyright © 2005, MetaQuotes Software Corp. |
//|                                        http://www.metaquotes.net |
//+------------------------------------------------------------------+
#property copyright "Copyright © 2005, MetaQuotes Software Corp."
#property link      "http://www.metaquotes.net"
//----
#property indicator_separate_window
#property indicator_buffers 1
#property indicator_color1 Red
//---- input parameters
extern int       periodMRO2=7;
//---- buffers
double RatedRangeBuffer[];
//+------------------------------------------------------------------+
//| Custom indicator initialization function                         |
//+------------------------------------------------------------------+
int init()
  {
//---- indicators
   SetIndexStyle(0,DRAW_LINE);
   SetIndexBuffer(0,RatedRangeBuffer);
//----
   return(0);
  }
//+------------------------------------------------------------------+
//| Custor indicator deinitialization function                       |
//+------------------------------------------------------------------+
int deinit()
  {
//---- TODO: add your code here
//----
   return(0);
  }
//+------------------------------------------------------------------+
//| Custom indicator iteration function                              |
//+------------------------------------------------------------------+
int start()
  {
   double Range,AvrRange;
   int shift,i;
   int    counted_bars=Bars-periodMRO2-1;
//---- TODO: add your code here
   for(shift=counted_bars;shift>=0;shift--)
     {
      Range=0.0;
      for(i=shift+1;i<=shift+periodMRO2;i++)
        {
         Range=Range+MathAbs(High[i]-Low[i]);
        }
      AvrRange=Range/periodMRO2;
      //RatedRangeBuffer[shift]=AvrRange/Point;
      RatedRangeBuffer[shift]=MathAbs(Close[shift+1]-Close[shift+4])/AvrRange;
     }
//----
   return(0);
  }
//+------------------------------------------------------------------+
Comments